Published: 2026-03-02T07:13:52.000Z
Chart AUD/JPY Update: Lower in consolidation
1
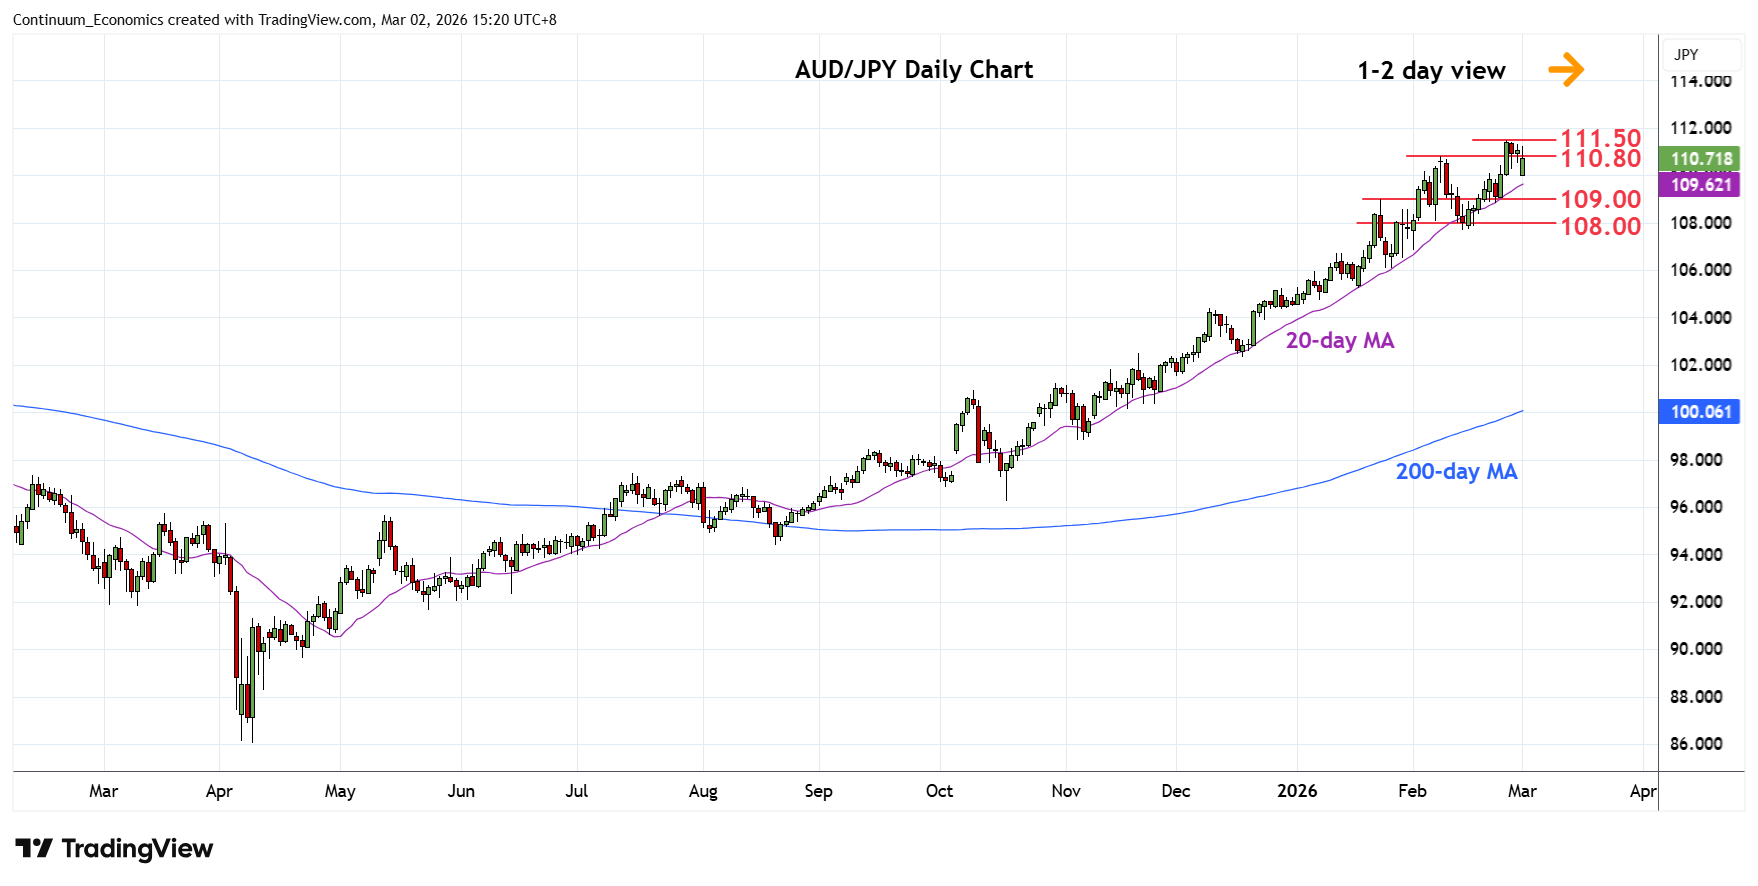
Lower in range from the 111.50 high as price consolidate gains from the 107.80, 13 February low
| Levels | Imp | Comment | Levels | Imp | Comment | |||
|---|---|---|---|---|---|---|---|---|
| R4 | 114.00 | * | congestion | S1 | 110.00 | * | congestion | |
| R3 | 113.00 | * | congestion | S2 | 109.00 | ** | congestion, Jan high | |
| R2 | 112.00 | ** | congestion | S3 | 107.80 | ** | congestion, 2007 yr high | |
| R1 | 111.50 | * | 26 Feb YTD high | S4 | 106.85 | 2 Feb low |
Asterisk denotes strength of level
07:10 GMT - Lower in range from the 111.50 high as price consolidate gains from the 107.80, 13 February low. Pullback see support starting at the 110.00 congestion which now underpin. Would take break here to open up room for deeper pullback to correct strong gains from the 96.25, October low. Break will open up room to the strong support at the 109.00 congestion and 108.00/107.80 area. Meanwhile, resistance is lowered to 110.80/111.50 February highs which is expected to cap. Clearance will extend the broader gains from the 2020 year low and see room to the 112.00/113.00 congestion.