Published: 2025-12-17T13:36:39.000Z
Chart USD/RUB Update: Studies improving
2
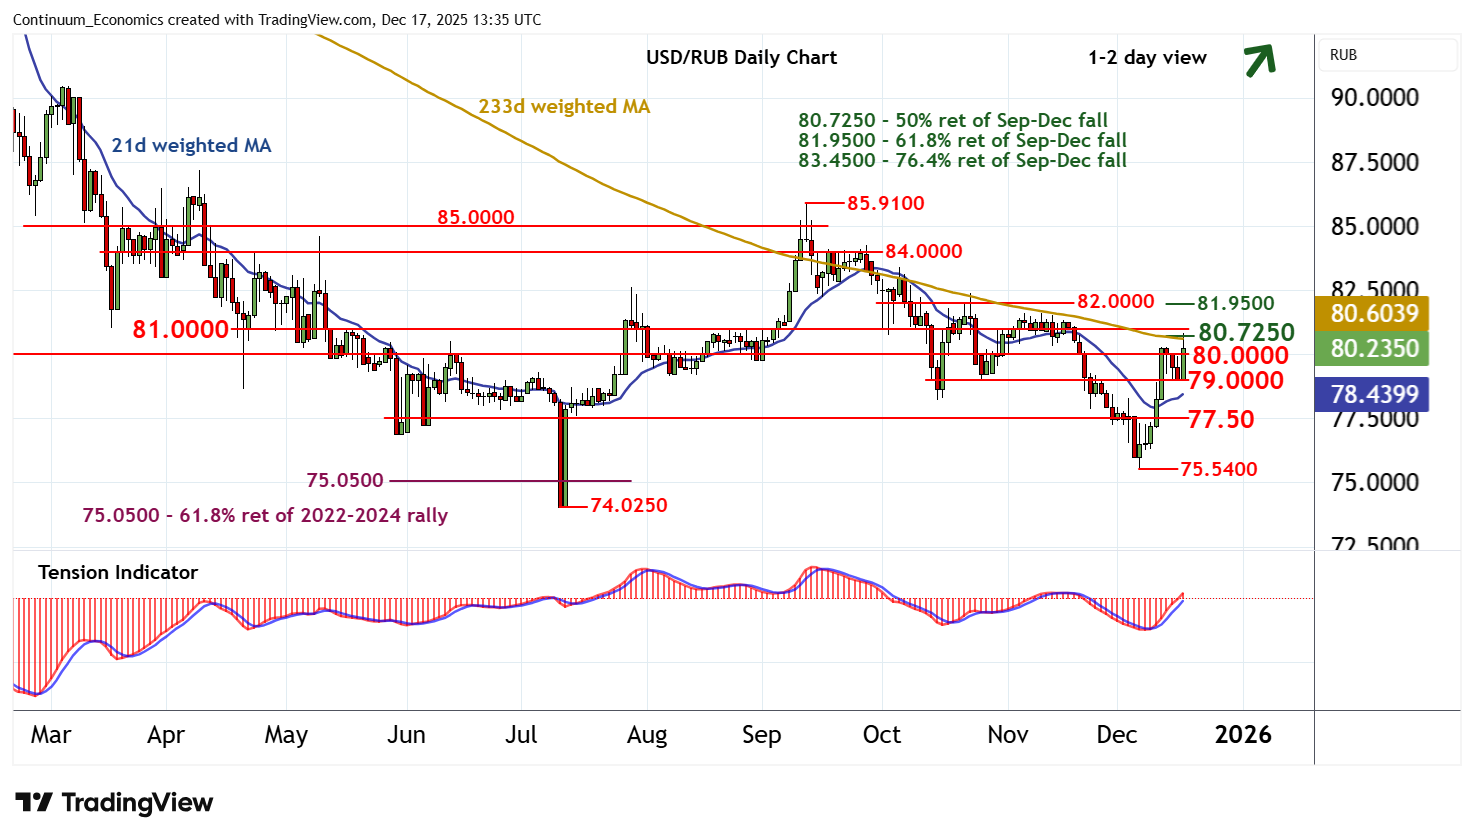
Consolidation above 79.0000 is giving way to a bounce
| Levels | Comment | Levels | Comment | |||||
| R4 | 81.9500 | ** | 61.8% ret of Sep-Dec fall | S1 | 79.0000 | * | recent lows | |
| R3 | 81.0000 | * | congestion | S2 | 77.5000 | * | congestion | |
| R2 | 80.7250 | * | 50% ret of Sep-Dec fall | S3 | 75.5400 | ** | 5 Dec (w) low | |
| R1 | 80.0000 | ** | congestion | S4 | 75.0500 | ** | 61.8% ret of 2022-2024 rally |
Asterisk denotes strength of level
13:10 GMT - Consolidation above 79.0000 is giving way to a bounce, with prices currently pressuring resistance within congestion around 80.0000 and the 80.7250 Fibonacci retracement. Daily stochastics are flat in overbought areas, suggesting potential for consolidation within here, before the rising daily Tension Indicator and improving weekly charts prompt further gains. A close above here will improve sentiment and extend December gains beyond 81.0000 towards the 81.9500 retracement. Meanwhile, a close below 79.0000, if seen, will give way to a deeper pullback, as initial focus then turns to congestion around 77.5000.