Published: 2026-02-25T14:56:49.000Z
Chart AUD/USD Update: Higher in range
6
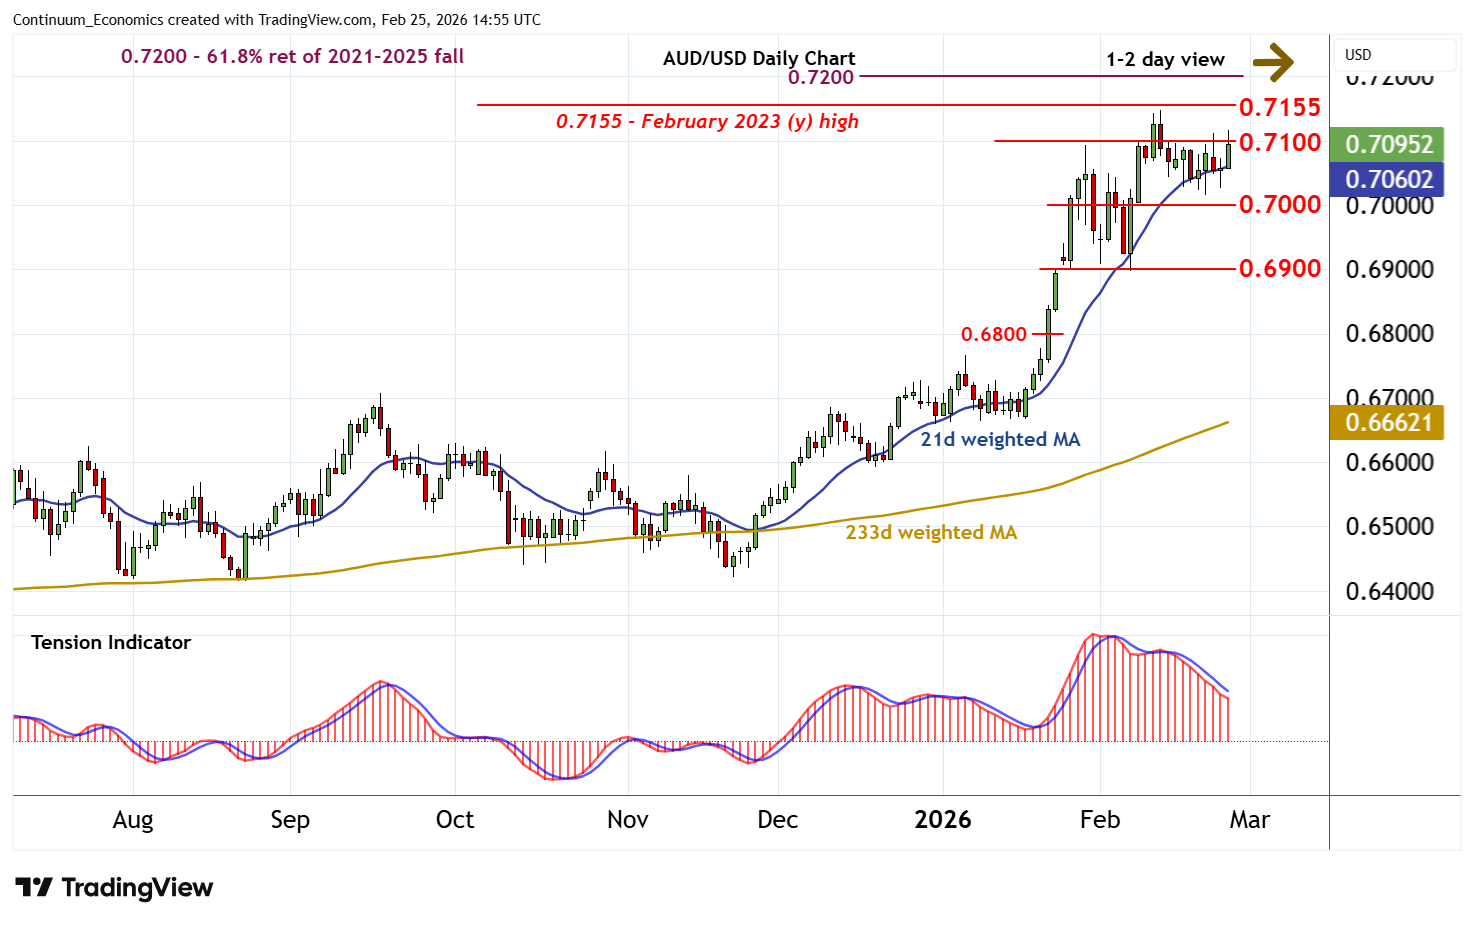
Minor losses have given way to a bounce back to resistance at 0.7100
| Levels | Imp | Comment | Levels | Imp | Comment | |||
|---|---|---|---|---|---|---|---|---|
| R4 | 0.7280~ | ** | June 2022 high | S1 | 0.7000 | * | congestion | |
| R3 | 0.7200 | ** | 61.8% ret of 2021-2025 fall | S2 | 0.6900 | ** | break level | |
| R2 | 0.7147/55~ | ** | 12 Feb YTD high; Feb 2023 (y) high | S3 | 0.6800 | break level | ||
| R1 | 0.7100 | break level | S4 | 0.6700 | * | break level |
Asterisk denotes strength of level
14:45 GMT - Minor losses have given way to a bounce back to resistance at 0.7100, where unwinding overbought intraday studies are prompting short-term reactions. Flat oversold daily stochastics are ticking higher, suggesting potential for a test above here. But the bearish daily Tension Indicator and flat overbought weekly stochastics should limit scope in renewed selling interest beneath strong resistance at the 0.7145 current year high of 12 February and the 0.7155~ year high of February 2023. Meanwhile, support remains down to congestion around 0.7000 and should underpin any immediate setbacks.