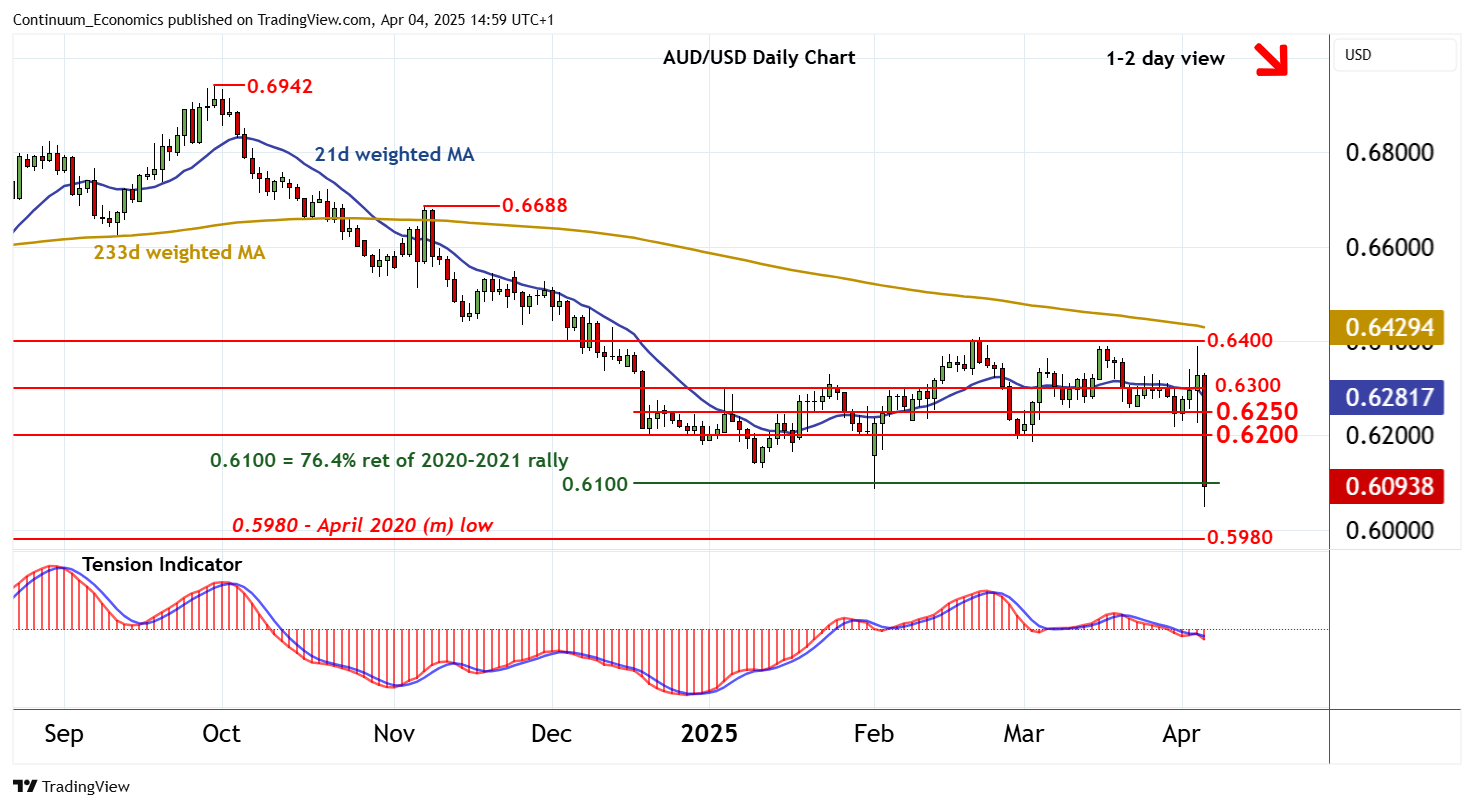
Chart AUD/USD Update: Fresh 5-year low in sharp selling pressure

Volatile gains failed to extend, with prices meeting strong selling interest just below critical resistance at 0.6400~

| Levels | Imp | Comment | Levels | Imp | Comment | |||
|---|---|---|---|---|---|---|---|---|
| R4 | 0.6400/08 | ** | range highs; 21 Feb YTD high | S1 | 0.6100 | ** | 76.4% ret of 2020-2021 rally | |
| R3 | 0.6300 | ** | congestion | S2 | 0.6050 | current YTD low | ||
| R2 | 0.6250 | * | break level | S3 | 0.5980/00 | ** | April 2020 low; figure | |
| R1 | 0.6200 | ** | congestion | S4 | 0.5500 | ** | March 2020 (y) low |
Asterisk denotes strength of level
14:50 BST - Volatile gains failed to extend, with prices meeting strong selling interest just below critical resistance at 0.6400~. Sharp losses have tested below support at the 0.6100 multi-year Fibonacci retracement to post a fresh year low around 0.6050, where flat oversold intraday studies are prompting short-term reactions. Daily readings have turned down and broader weekly charts are coming under pressure, pointing to room for still deeper losses in the coming sessions. A close below 0.6100 will add weight to sentiment and extend multi-year losses towards the 0.5980 low of April 2020. Meanwhile, a close above congestion resistance at 0.6200, if seen, would help to stabilise price action and prompt consolidation around 0.6250.