Published: 2025-07-23T11:02:20.000Z
Chart EUR/CAD Update: Under pressure

Senior Technical Strategist
-
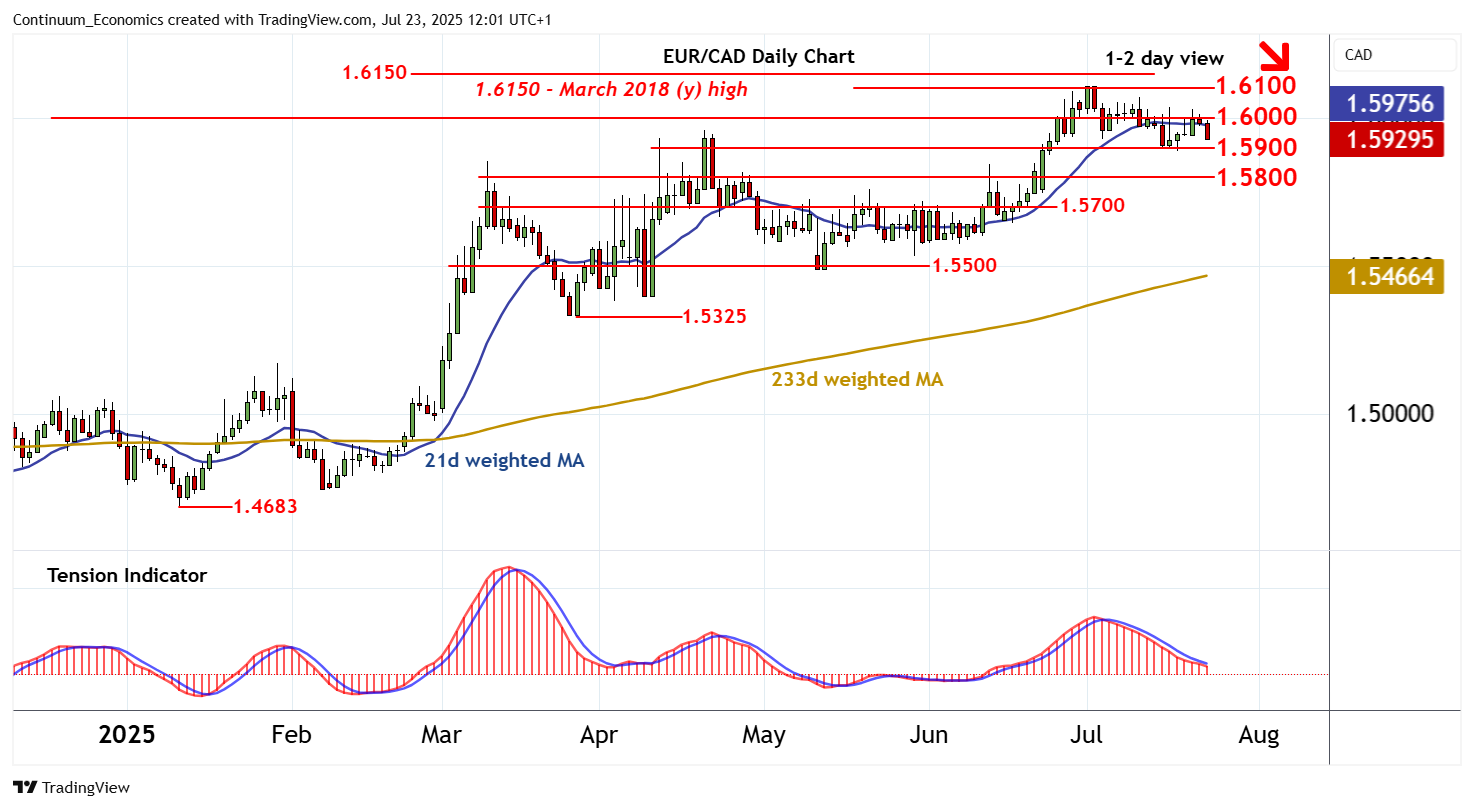
Consolidation around congestion resistance at 1.6000 is giving way to a pullback
| Level | Comment | Level | Comment | |||||
|---|---|---|---|---|---|---|---|---|
| R4 | 1.6200 | historic congestion | S1 | 1.5900 | congestion | |||
| R3 | 1.6150~ | ** | March 2018 (y) high | S2 | 1.5800 | congestion | ||
| R2 | 1.6100/09 | * | cong; 1 Jul YTD high | S3 | 1.5700 | break level | ||
| R1 | 1.6000 | ** | congestion | S4 | 1.5600 | ** | congestion lows |
Asterisk denotes strength
11:45 BST - Consolidation around congestion resistance at 1.6000 is giving way to a pullback, as intraday studies turn down, with prices currently trading around 1.5930. Rising daily stochastics are flattening and the daily Tension Indicator continues to track lower, highlighting room for further losses to congestion support at 1.5900. Broader weekly charts are also under pressure, pointing to room for a later break and extension of July losses towards further congestion around 1.5800. Meanwhile, resistance remains at 1.6000 and should continue to cap any immediate tests higher.