Published: 2025-09-10T08:27:41.000Z
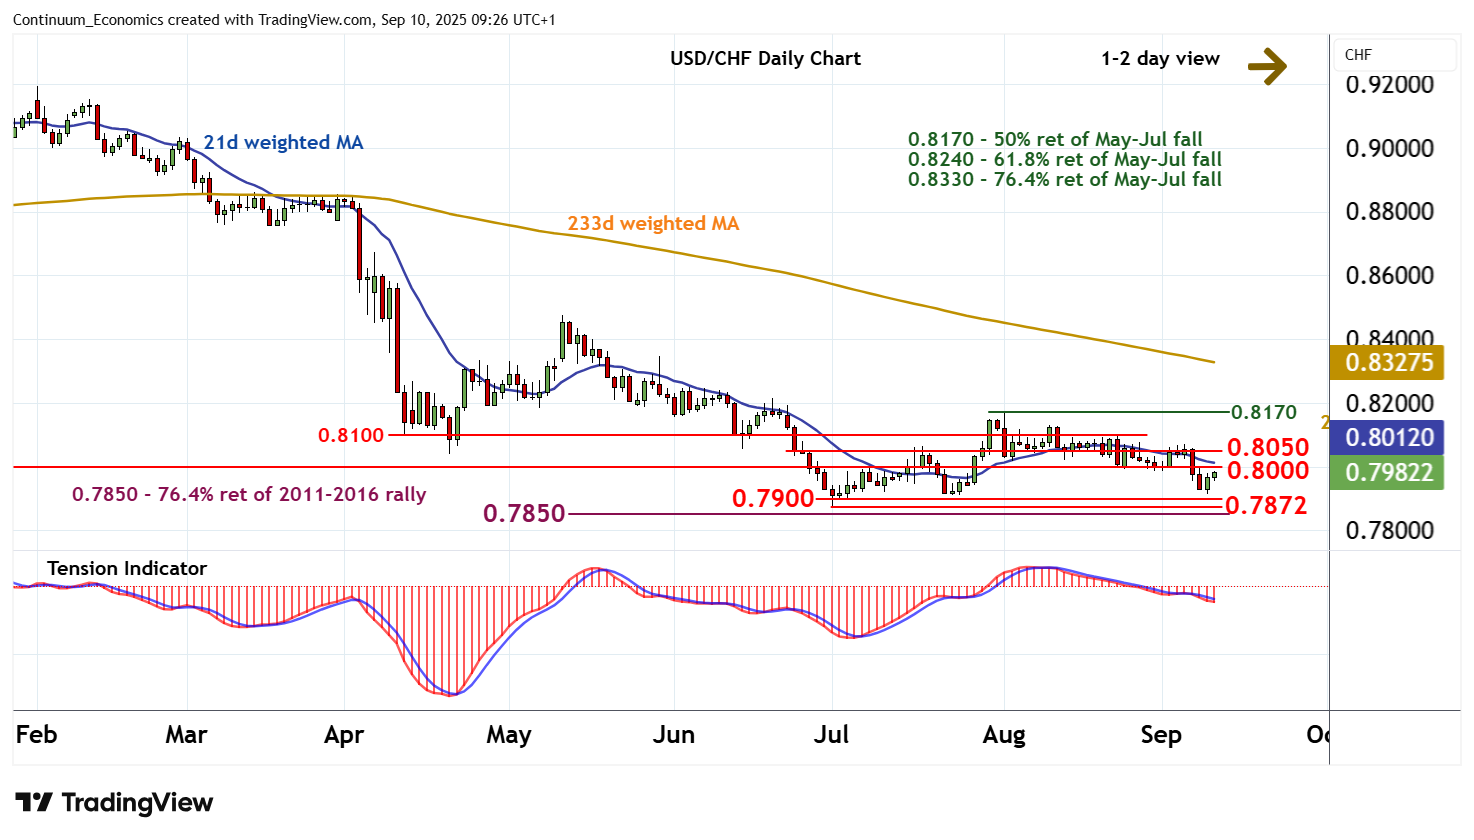
Chart USD/CHF Update: Limited tests higher
0
-
The bounce from the 0.7915 low of 9 September has reached 0.7980
| Level | Comment | Level | Comment | |||||
|---|---|---|---|---|---|---|---|---|
| R4 | 0.8132 | 11 Aug (w) high | S1 | 0.7900 | congestion | |||
| R3 | 0.8100 | * | congestion | S2 | 0.7872 | ** | 1 Jul YTD low | |
| R2 | 0.8050 | break level | S3 | 0.7850 | ** | 76.4% ret of 2011-2016 rally | ||
| R1 | 0.8000 | ** | congestion | S4 | 0.7800 | * | figure |
Asterisk denotes strength of level
09:15 BST - The bounce from the 0.7915 low of 9 September has reached 0.7980, where overbought intraday studies are prompting short-term consolidation. Oversold daily stochastics are ticking higher, suggesting room for a test of congestion resistance at 0.8000. But the bearish daily Tension Indicator and mixed weekly charts are expected to limit any break in renewed selling interest beneath 0.8050. Meanwhile, support remains at congestion around 0.7900 and extends to the 0.7872 current year low of 1 July. But a close below the 0.7850 Fibonacci retracement is needed to turn sentiment outright negative and confirm continuation of 2016 losses.