Published: 2026-05-15T07:35:57.000Z
Chart GBP/USD Update: Extending May losses
5
Anticipated losses have extended in sharp selling interest
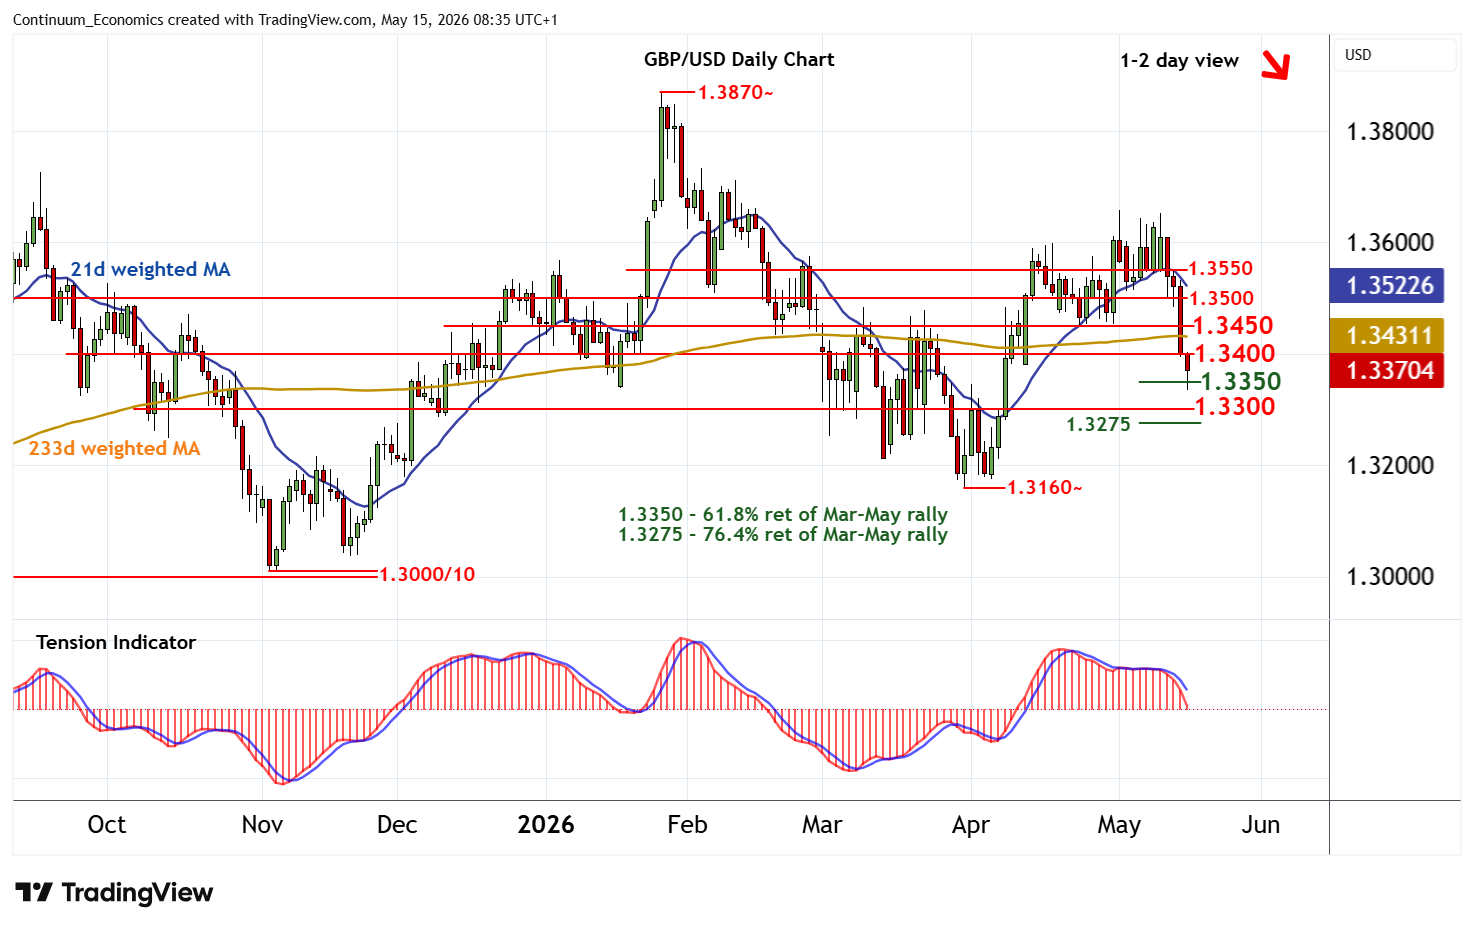
| Level | Comment | Level | Comment | |||||
|---|---|---|---|---|---|---|---|---|
| R4 | 1.3550 | * | congestion | S1 | 1.3350 | ** | 61.8% ret of Mar-May rally | |
| R3 | 1.3500 | ** | congestion | S2 | 1.3300 | ** | congestion | |
| R2 | 1.3450 | break level | S3 | 1.3275 | ** | 76.4% ret of Mar-May rally | ||
| R1 | 1.3400 | ** | congestion | S4 | 1.3200 | ** | congestion |
Asterisk denotes strength of level
08:10 BST - Anticipated losses have extended in sharp selling interest, with prices testing below the 1.3350 Fibonacci retracement before bouncing to 1.3365. Daily readings continue to track lower and broader weekly charts are deteriorating, highlighting room for further losses in the coming sessions. A break back below 1.3350 will open up congestion around 1.3300. But flat oversold daily stochastics should limit any deeper losses in short-covering/consolidation above the 1.3275 retracement. Meanwhile, resistance is lowered to congestion around 1.3400. A close back above here would help to stabilise sentiment and prompt consolidation beneath 1.3450.