Published: 2025-04-17T00:35:29.000Z
Chart NZD/USD Update: Consolidating at .5930, 50% Fibonacci level

Technical Analyst
1
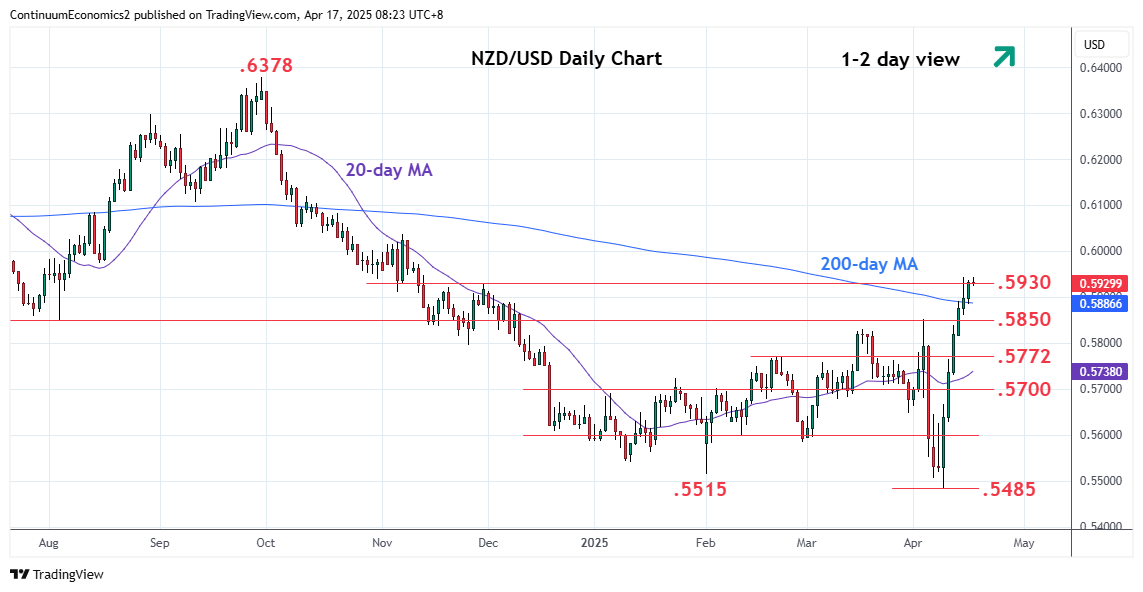
Little change, as prices consolidate test of the .5930 resistance and 50% Fibonacci level
| Levels | Imp | Comment | Levels | Imp | Comment | |||
|---|---|---|---|---|---|---|---|---|
| R4 | .6050 | * | congestion | S1 | .5850 | * | Apr/Aug lows | |
| R3 | .6037 | * | 7 Nov high, 61.8% | S2 | .5800 | * | congestion | |
| R2 | .6000 | ** | congestion | S3 | .5772 | ** | Feb high | |
| R1 | .5930 | * | 29 Nov high, 50% | S4 | .5700 | * | congestion |
Asterisk denotes strength of level
00:25 GMT - Little change, as prices consolidate test of the .5930 resistance and 50% Fibonacci level. The stretched daily studies caution corrective pullback with support starting at .5850 lows of April and August last year which is expected to underpin. Break here, if seen, will open up room for deeper correction to the strong support at the .5800 level and extending to .5772, February high. Meanwhile, a later break above the .5930 resistance will further retrace the September/April losses and see scope to the .6000 congestion and .6037 resistance and 61.8% Fibonacci level.