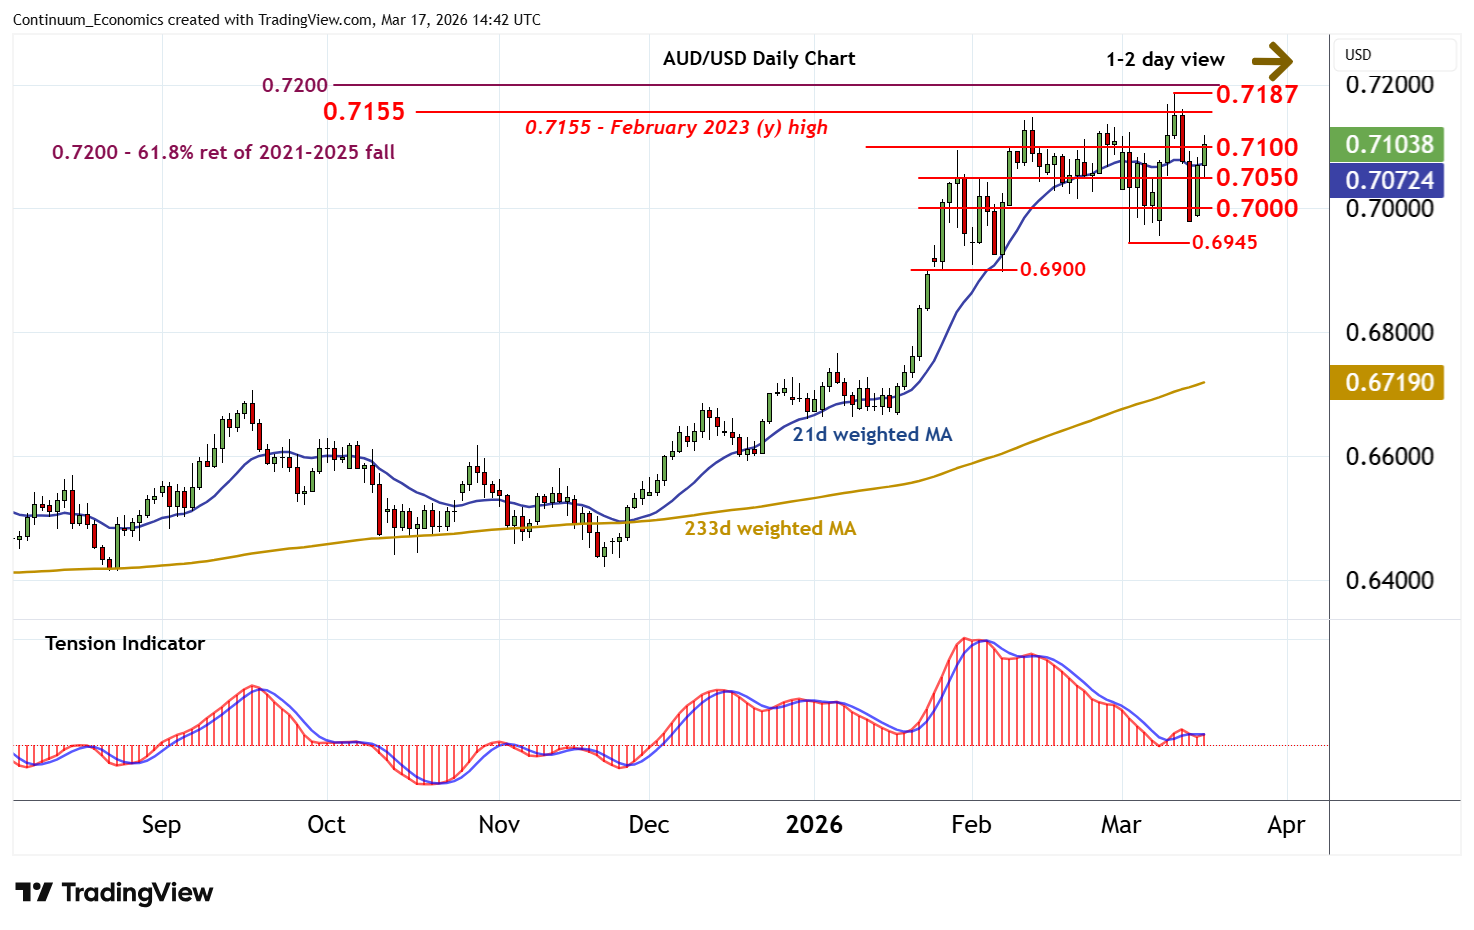
Chart AUD/USD Update: Edging higher in range
Consolidation above 0.7050 has given way to anticipated gains
| Levels | Imp | Comment | Levels | Imp | Comment | |||
|---|---|---|---|---|---|---|---|---|
| R4 | 0.7200 | ** | 61.8% ret of 2021-2025 fall | S1 | 0.7050 | * | congestion | |
| R3 | 0.7185~ | * | 11 Mar YTD high | S2 | 0.7000 | * | congestion | |
| R2 | 0.7155~ | ** | Feb 2023 (y) high | S3 | 0.6945 | ** | 3 Mar (w) low | |
| R1 | 0.7100 | break level | S4 | 0.6900 | ** | break level |
Asterisk denotes strength of level
14:30 GMT - Consolidation above 0.7050 has given way to anticipated gains, with prices currently pressuring resistance at 0.7100. Daily readings are mixed/positive, highlighting room for a test above here. But negative weekly charts should limit scope in renewed selling interest towards strong resistance within the 0.7155~ year high of February 2023 and the 0.7185~ current year high of 11 March. Following cautious/corrective trade, fresh losses are looked for. A break below 0.7050 will open up congestion around 0.7000. But a further close below the 0.6945 weekly low of 3 March is needed to turn sentiment negative and confirm a deeper correction, as focus then turns to 0.6900.