Published: 2025-04-10T15:58:16.000Z
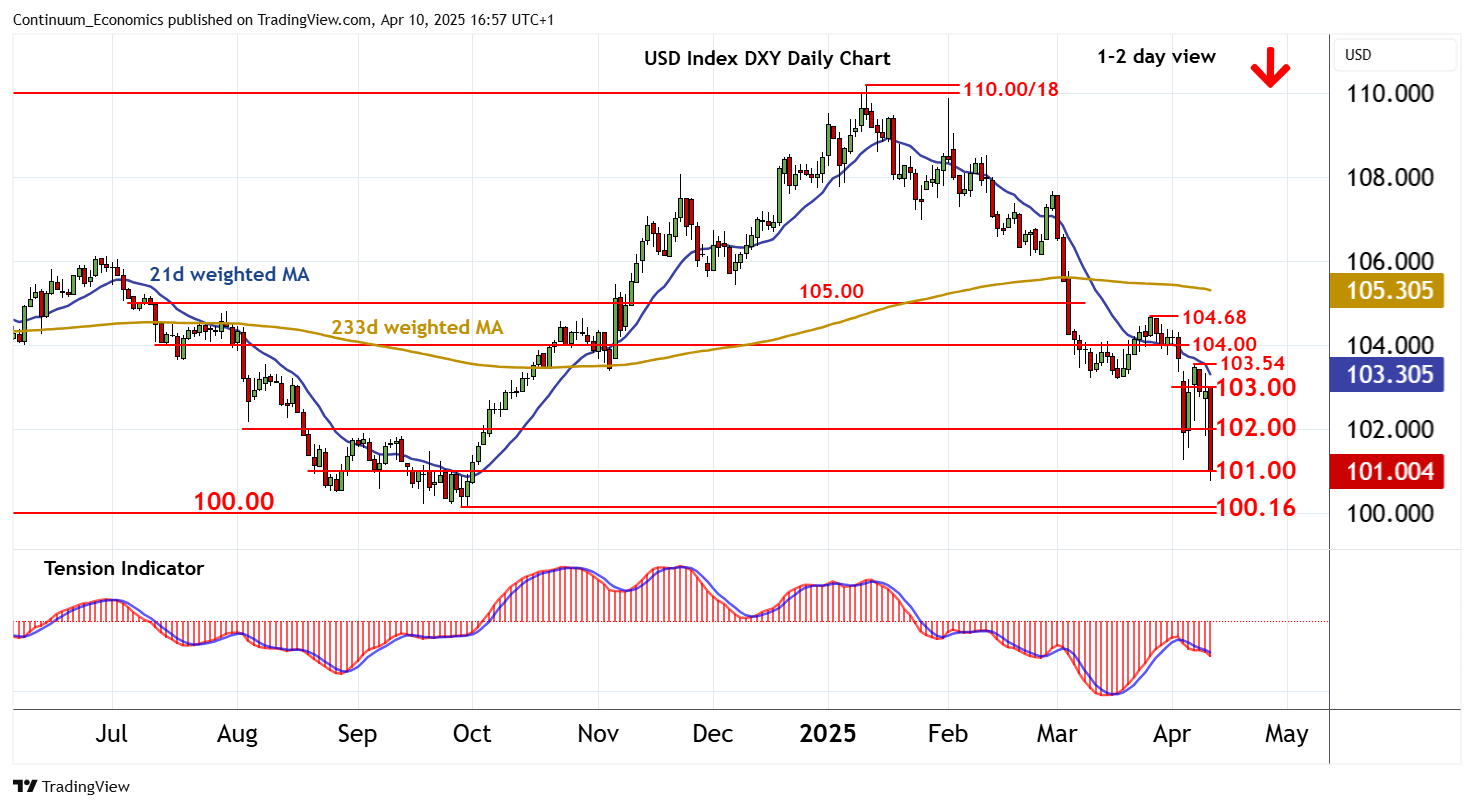
Chart USD Index DXY Update: Fresh 2025 year lows

Senior Technical Strategist
-
Cautious trade around 102.00 has given way to the anticipated break
| Levels | Imp | Comment | Levels | Imp | Comment | |||
|---|---|---|---|---|---|---|---|---|
| R4 | 104.00 | * | congestion | S1 | 101.00 | * | congestion | |
| R3 | 103.54 | 7 Apr high | S2 | 100.16 | ** | 27 Sep 2024 (y) low | ||
| R2 | 103.00 | congestion | S3 | 100.00 | ** | congestion | ||
| R1 | 102.00 | ** | break level | S4 | 99.00 | ** | 61.8% ret of 2021-2022 rally |
Asterisk denotes strength of level
16:50 BST - Cautious trade around 102.00 has given way to the anticipated break, as intraday studies continue to track lower, with prices currently pressuring congestion support at 101.00. Daily readings are also under pressure and broader weekly charts are bearish, highlighting room for further losses in the coming sessions. A break below 101.00 will add weight to already bearish sentiment and extend January losses towards the 100.16 year low of 27 September 2024. Meanwhile, a break back above 102.00, if seen, will help to stabilise price action and prompt consolidation beneath congestion resistance at 103.00.