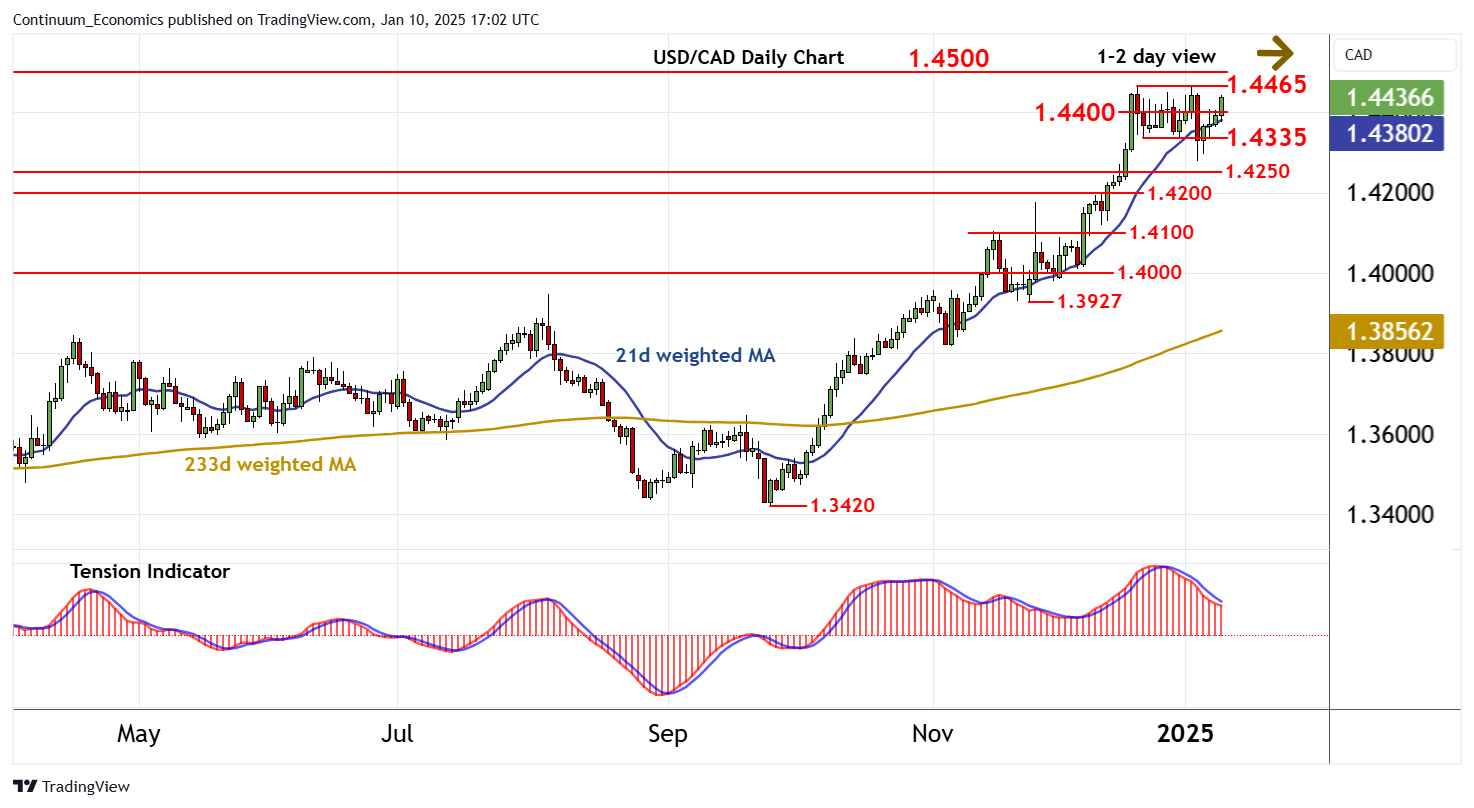
Chart USD/CAD Update: Edging higher in range

Little change, as mixed intraday studies keep near-term sentiment cautious and prompt consolidation above support at 1.4400

| Levels | Imp | Comment | Levels | Imp | Comment | |||
|---|---|---|---|---|---|---|---|---|
| R4 | 1.4690 | ** | January 2016 (y) high | S1 | 1.4400 | break level | ||
| R3 | 1.4667 | ** | March 2020 (y) high | S2 | 1.4335 | 20 Dec low | ||
| R2 | 1.4500 | ** | congestion | S3 | 1.4280 | 6 Jan low | ||
| R1 | 1.4465 | ** | 19 Dec 2024 (y) high | S4 | 1.4250 | break level |
Asterisk denotes strength of level
16:40 GMT - Little change, as mixed intraday studies keep near-term sentiment cautious and prompt consolidation above support at 1.4400. Oversold daily stochastics are unwinding, suggesting room for a test of critical resistance at the 1.4465 year high of 19 December 2024. But weekly stochastics are flat in overbought areas, suggesting any initial tests could give way to consolidation, before the rising weekly Tension Indicator and improving longer-term charts prompt a break. A close above here will turn sentiment positive and confirm continuation of May 2021 gains. Meanwhile, support is raised to 1.4400 and extends down to the 1.4335 low of 20 December. A fresh close beneath here, if seen, would add weight to sentiment and open up a pullback, initially to support at 1.4250.