Published: 2024-11-27T17:05:06.000Z
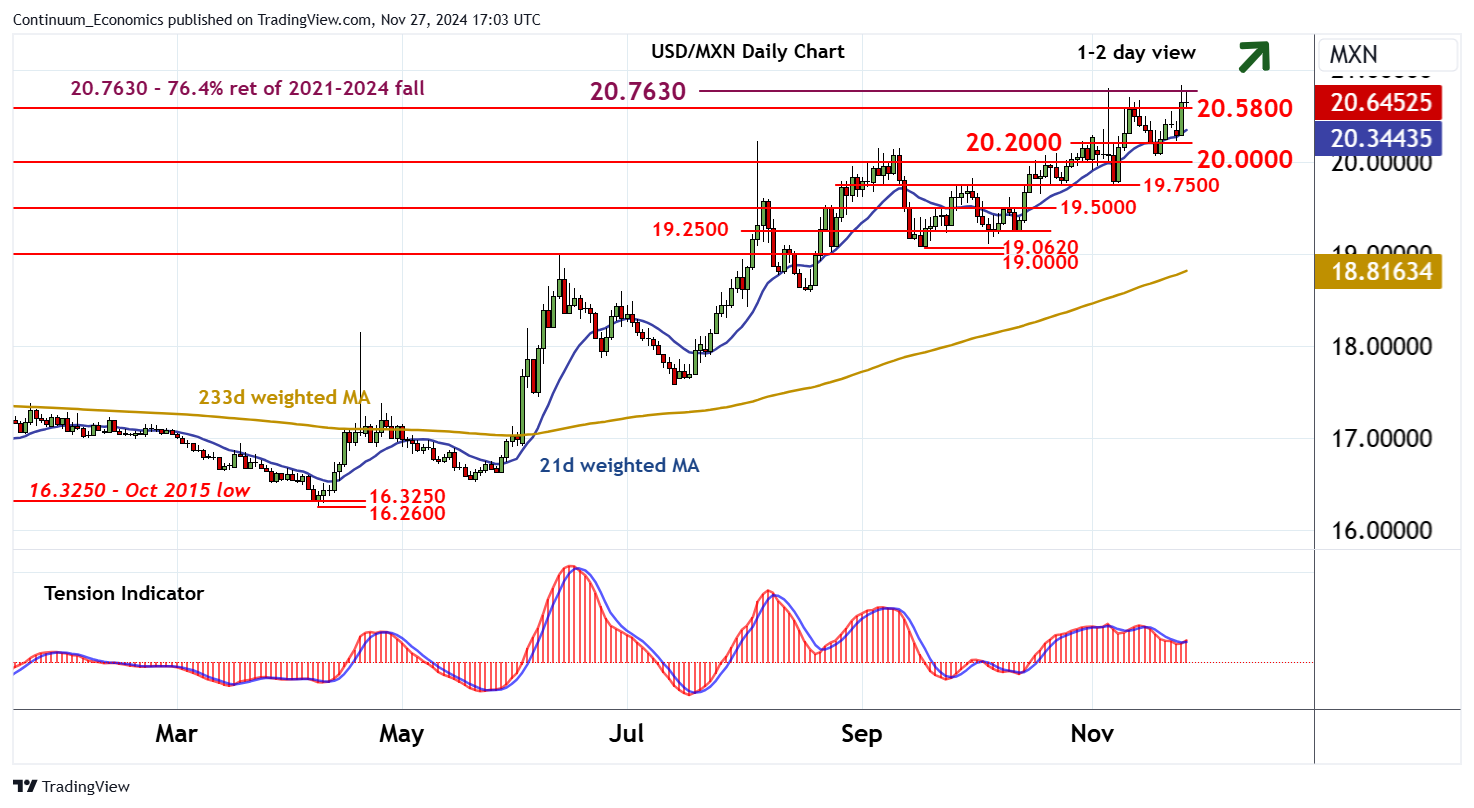
Chart USD/MXN Update: Balanced at year highs - studies improving

Senior Technical Strategist
1

The test of support at the 20.2000 break level has given way to a bounce from above 20.0000

| Levels | Imp | Comment | Levels | Imp | Comment | |||
|---|---|---|---|---|---|---|---|---|
| R4 | 21.0000 | * | figure | S1 | 20.2000 | break level | ||
| R3 | 20.8280 | ** | 26 Nov YTD high | S2 | 20.0000 | * | congestion | |
| R2 | 20.7630 | ** | 76.4% ret of 2021-2024 fall | S3 | 19.7500 | * | break level | |
| R1 | 20.5800 | ** | September 2022 (m) high | S4 | 19.6460 | 18 Oct low |
Asterisk denotes strength of level
16:50 BST - The test of support at the 20.2000 break level has given way to a bounce from above 20.0000, with prices currently balanced at fresh year highs within the 20.5800 - 20.7630 resistance area. Daily readings are edging higher and broader weekly charts are improving, highlighting a more constructive tone. But a close above the 20.7630 Fibonacci retracement is needed to turn sentiment positive and extend April gains beyond the 20.8280 current year high of 26 November towards 21.0000. Meanwhile, an unexpected close below congestion support at 20.0000 would turn sentiment negative and open up a test of 19.7500.