Chart USD Index DXY Update: Consolidating gains - background positive
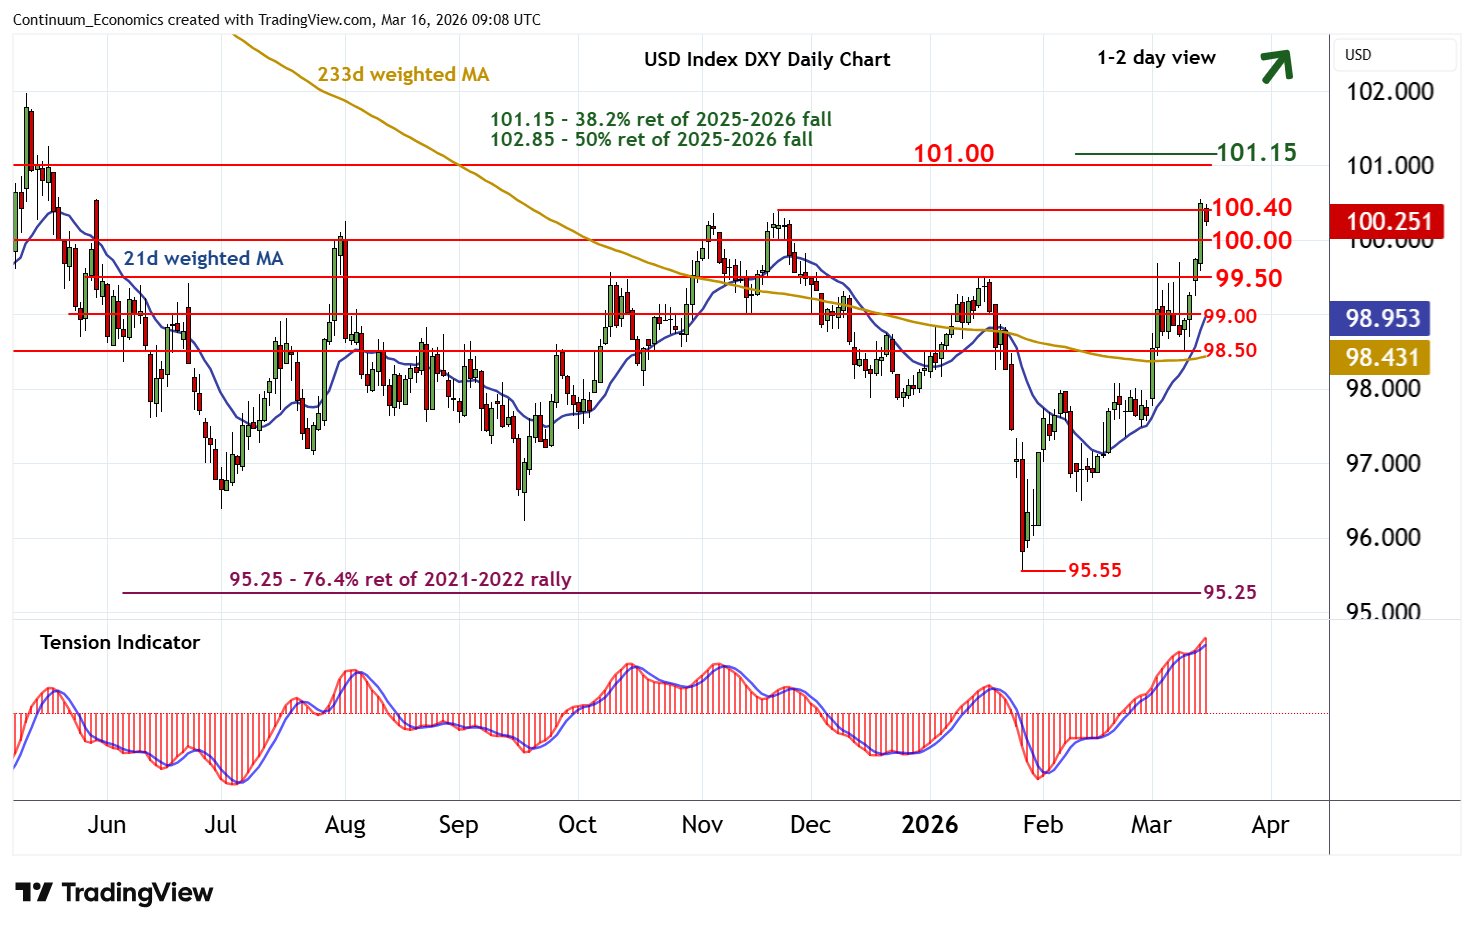
The anticipated break above the 100.40 monthly high of 21 November has posted a fresh 2026 year high around 100.54
| Levels | Imp | Comment | Levels | Imp | Comment | |||
|---|---|---|---|---|---|---|---|---|
| R4 | 102.00 | * | congestion | S1 | 100.00 | ** | congestion | |
| R3 | 101.15 | ** | 38.2% ret of 2025-2026 fall | S2 | 99.50 | * | congestion | |
| R2 | 101.00 | * | congestion | S3 | 99.00 | ** | congestion | |
| R1 | 100.40/54 | ** | 21 Nov (m); 13 Mar YTD highs | S4 | 98.50 | * | congestion |
Asterisk denotes strength of level
08:55 GMT - The anticipated break above the 100.40 monthly high of 21 November has posted a fresh 2026 year high around 100.54, before turning back as overbought intraday studies unwind and overbought daily stochastics flatten. Immediate focus is on congestion support at 100.00. But the rising daily Tension Indicator and positive weekly charts should limit any break in renewed buying interest above further congestion around 99.50. Following cautious/corrective trade, fresh gains are looked for. A later close above 100.40/54 will improve sentiment and extend late-January gains initially towards resistance at congestion around 101.00 and the 101.15 multi-month Fibonacci retracement.