Continuum Economics
  • Search
  • About Us
  • Buy
  • Invite A Friend
  • My Basket
  • Articles
  • Calendar
  • Forecasts
  • Events
  • Data
  • Newsletters
  • My Alerts
  • Community
  • Directory
  • About Us
  • Buy
  • Invite A Friend
  • My Basket
  • Articles
    • All
    • Thematic
    • Tactical
    • Asia
    • EMEA
    • Americas
    • Newsletters
    • Freemium
    • Editor's Choice
    • Most Viewed
    • Most Shared
    • Most Liked
  • Calendar
    • Interactive
      • China
      • United States
      • Eurozone
      • United Kingdom
    • Month Ahead
    • Reviews
    • Previews
  • Forecasts
    • Forecasts
    • Key Views
  • Events
    • Media
    • Conference Calls
  • Data
    • Country Insights
    • Shadow Credit Ratings
    • Full CI Data Download
  • Newsletters
  • My Alerts
  • Community
    • FX
    • Fixed Income
    • Macro Strategy
    • Credit Markets
    • Equities
    • Commodities
    • Precious Metals
    • Renewables
  • Directory
  • My Account
  • Notifications Setup
  • Administration Panel
  • Account Details
  • Recent Devices
  • Distribution Lists
  • Shared Free Trials
  • Saved Articles
  • Shared Alerts
  • My Posts
Back
Published: 2026-03-19T08:05:54.000Z

Chartbook: Chart AUD/USD: Lower in consolidation beneath .7200 Fibonacci level

-

Bullish start to the year to break the .6700 level has seen sharp rally to extend gains from the April 2025 year low

Bullish start to the year to break the .6700 level has seen sharp rally to extend gains from the April 2025 year low before settling into consolidation beneath the .6200, 61.8% Fibonacci retracement. 

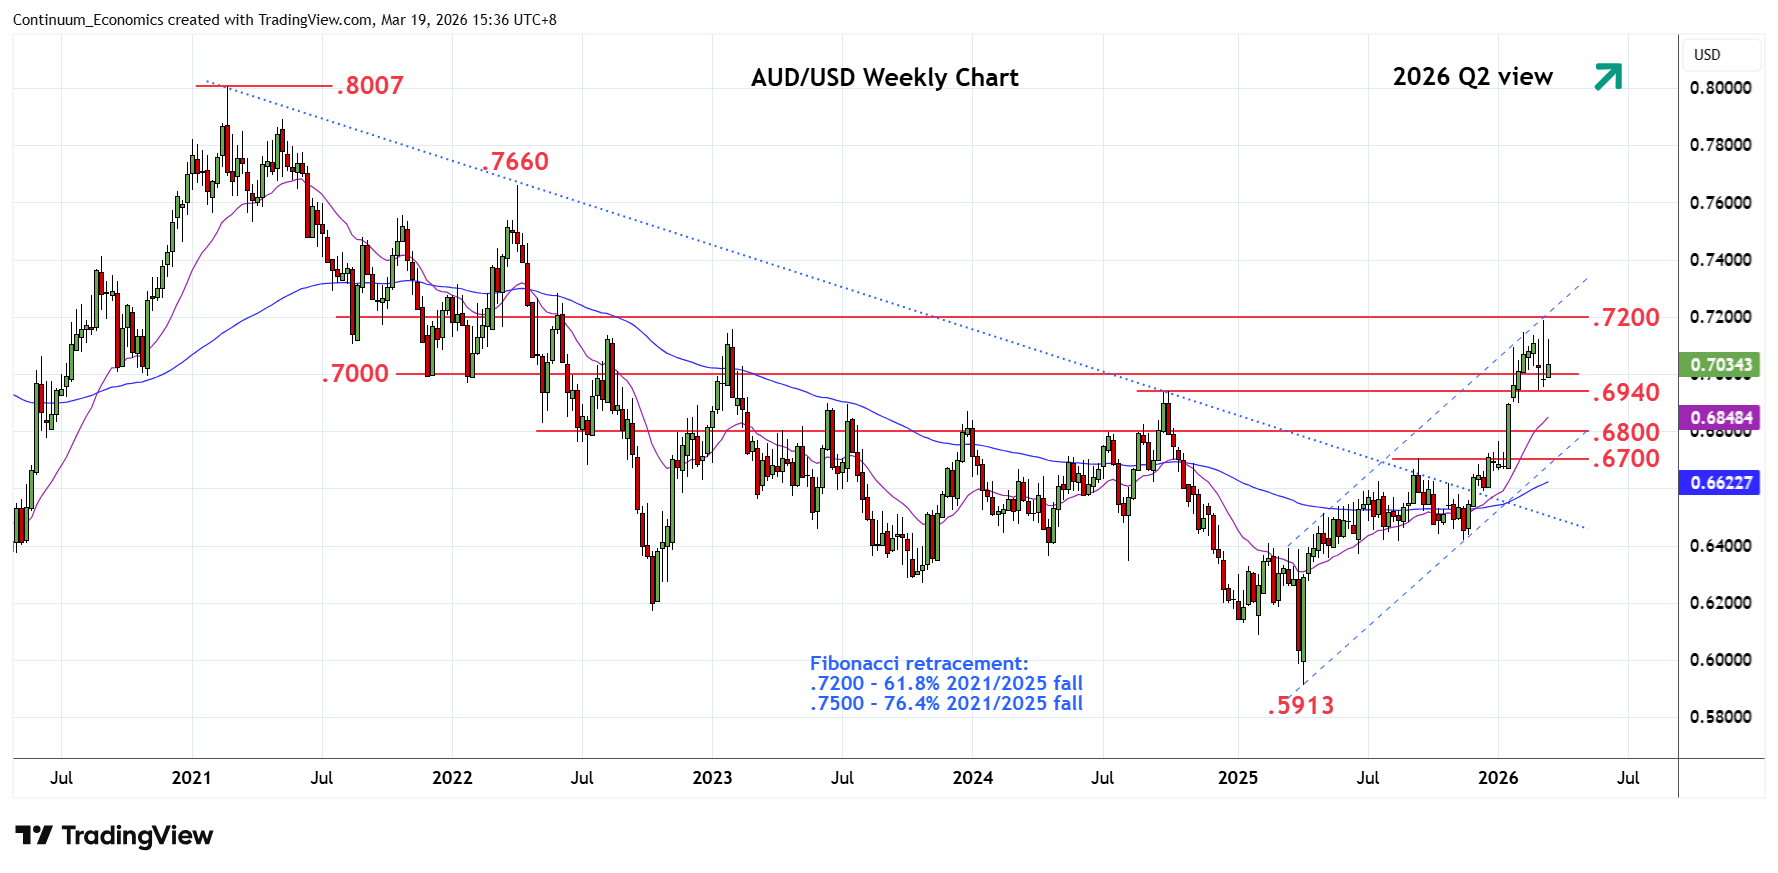
Choppy trade from the latter to break the .7000 figure has since found support at the .6940, 2024 year high. Break of the latter will open up room for deeper pullback within the bullish channel from the April 2025 year low to support at the .6800 congestion. Lower still, if seen, will open up room to the strong support at the .6725/00, 2025 year high, which should underpin. Corrective pullback is expected to give way to renewed buying interest later to extend gains from the .5913, 2025 year low.

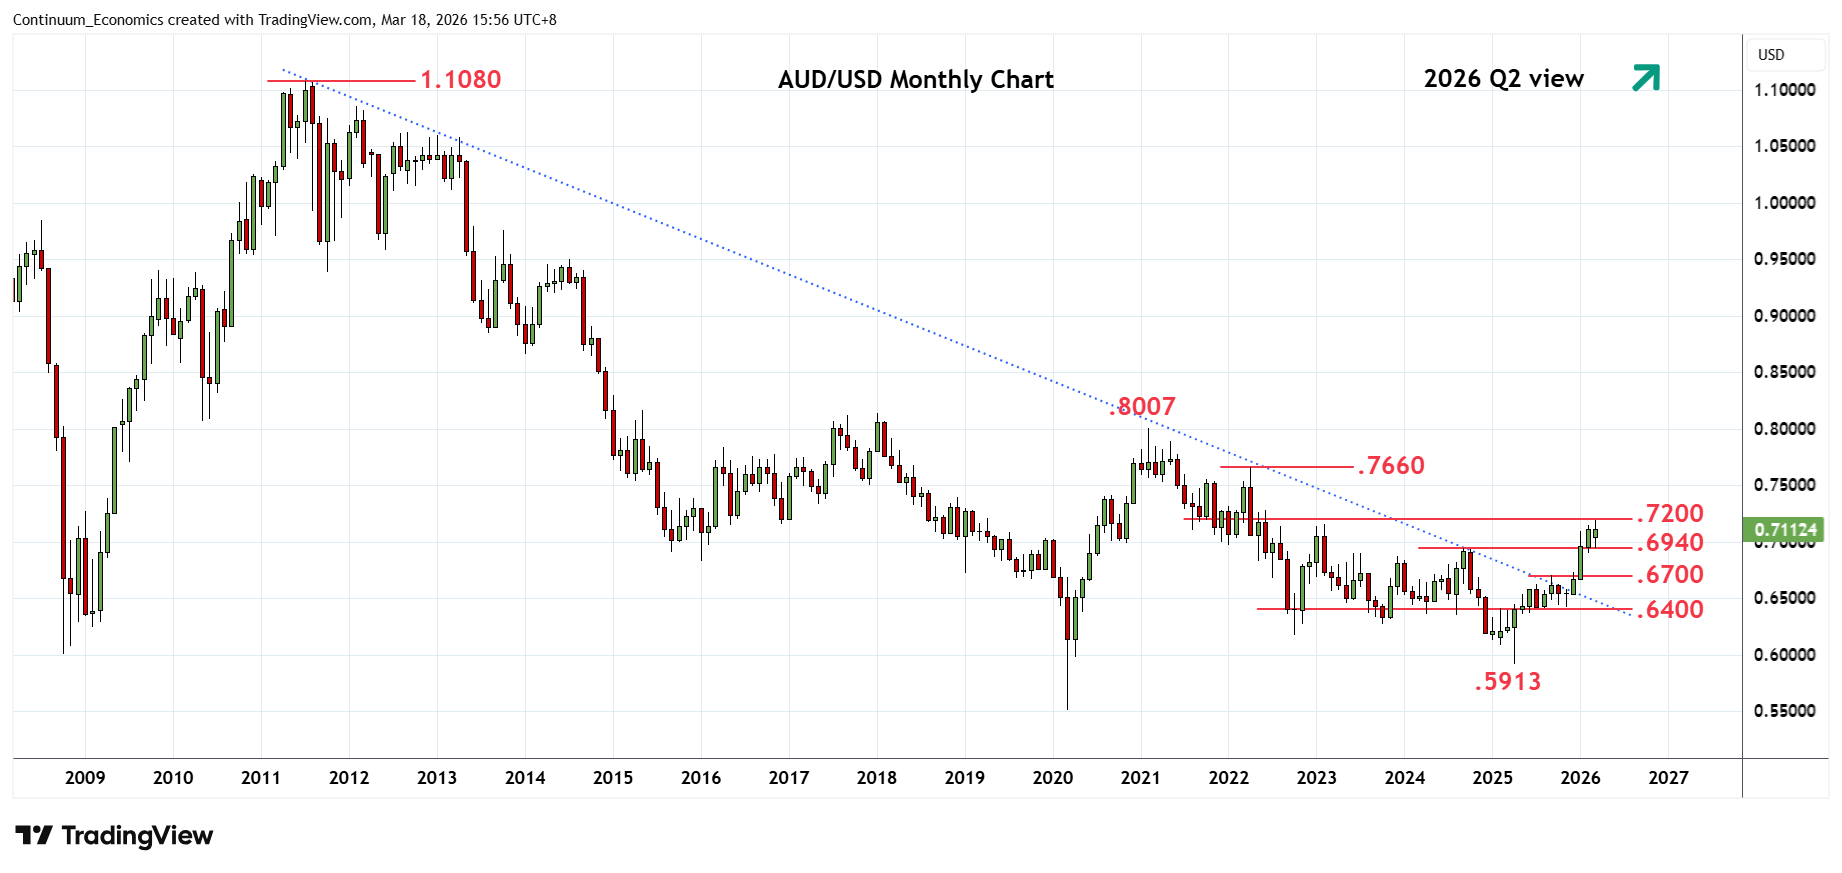
Bullish break of the trendline from the 2021 year high at the start of the year and the long-term trendline from the 2011 year high in December 2025 points to bulls reasserting going forwards. Above the .7200 level will see room for extension to the .7400 level and .7500, 76.4% Fibonacci retracement.

Continue to read the article for free
Login

or

or

Topics
Technical Analysis
AUD/USD-TA
ChartBook

GENERAL

  • Home
  • About Us
  • Our Team
  • Careers

LEGAL

  • Terms and Conditions
  • Privacy Policy
  • Compliance
  • GDPR

GET IN TOUCH

  • Contact Us
Continuum Economics
The Technical Analyst Awards Winner 2021
The Technical Analyst Awards Finalist 2020

© 2026 Continuum Economics

image