Published: 2026-01-30T05:34:34.000Z
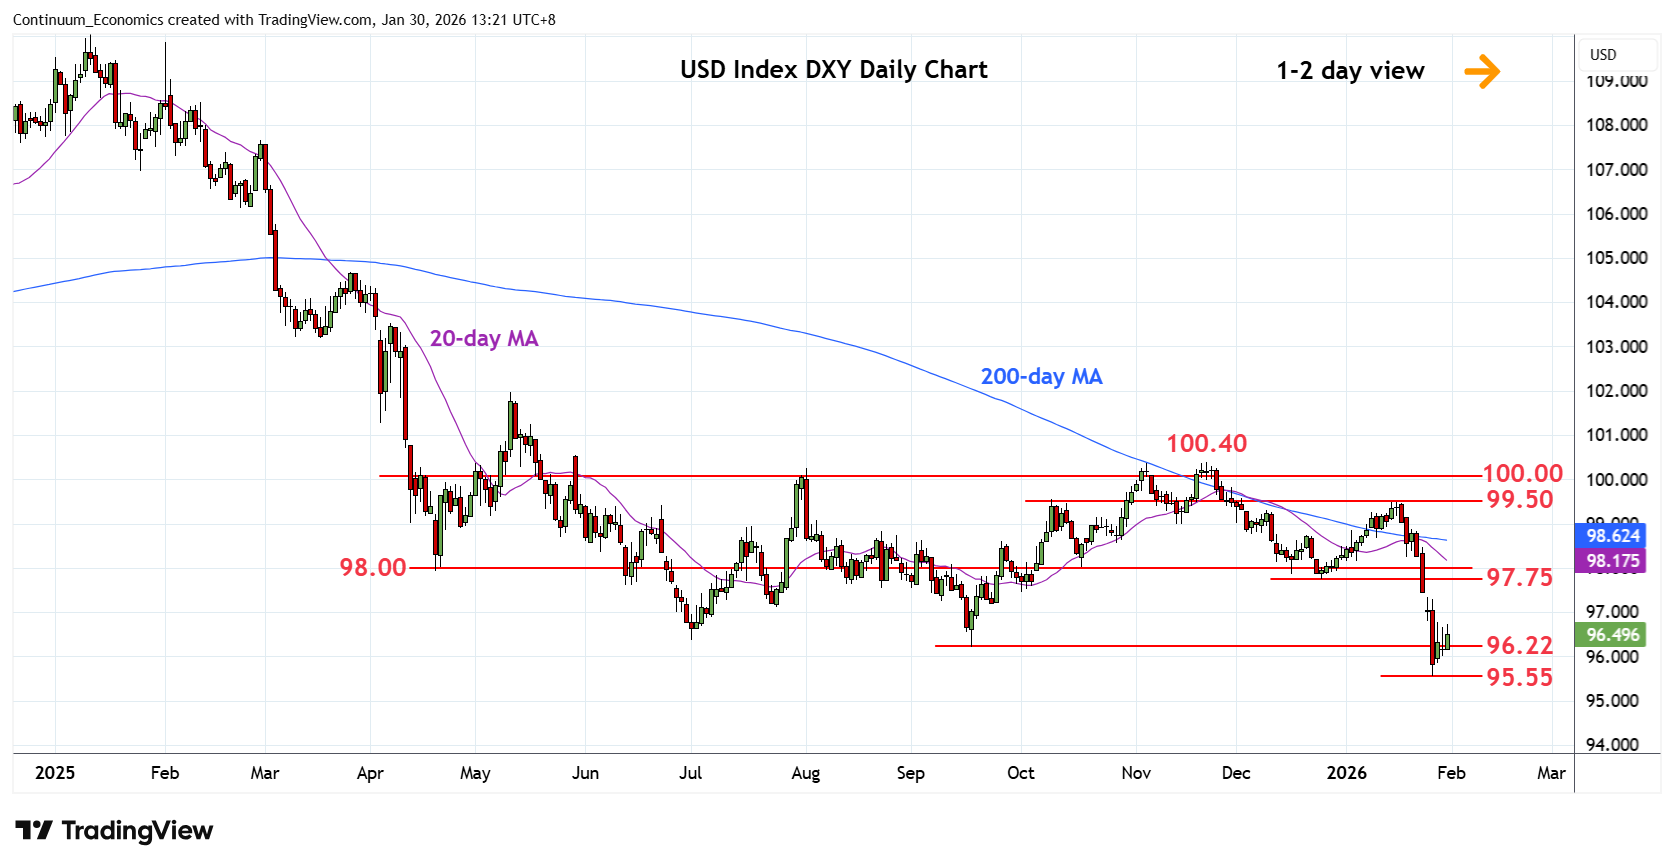
Chart USD Index DXY Update: Range-bound above 95.55 low
-
Little change, as prices stays in range above the 95.55 Tuesday's low to consolidate sharp losses from the 99.50 high of last week
| Levels | Imp | Comment | Levels | Imp | Comment | |||
|---|---|---|---|---|---|---|---|---|
| R4 | 98.00 | ** | congestion | S1 | 95.55 | ** | 27 Jan YTD low | |
| R3 | 97.75 | ** | Dec low, congestion | S2 | 95.25 | * | 76.4% 2021/2022 rally | |
| R2 | 97.42 | * | 23 Jan low, gap | S3 | 95.00 | * | congestion | |
| R1 | 97.00 | * | congestion | S4 | 94.63 | * | Jan 2022 year low |
Asterisk denotes strength of level
05:30 GMT - Little change, as prices stays in range above the 95.55 Tuesday's low to consolidate sharp losses from the 99.50 high of last week. Bounce see prices unwinding oversold daily studies and see room to retest resistance at the 97.00 level and 97.42, low of last Friday and gap area. Corrective bounce expected to give way to renewed selling pressure later to extend the broader losses from 2022 year high to support at 95.25/95.00, 76.4% Fibonacci level and congestion area. Lower still will see continuation to the 2022 year low at 94.63 and the 94.50/94.00 congestion.