Published: 2026-03-12T11:53:35.000Z
Chart USD/ZAR Update: Testing higher levels
1
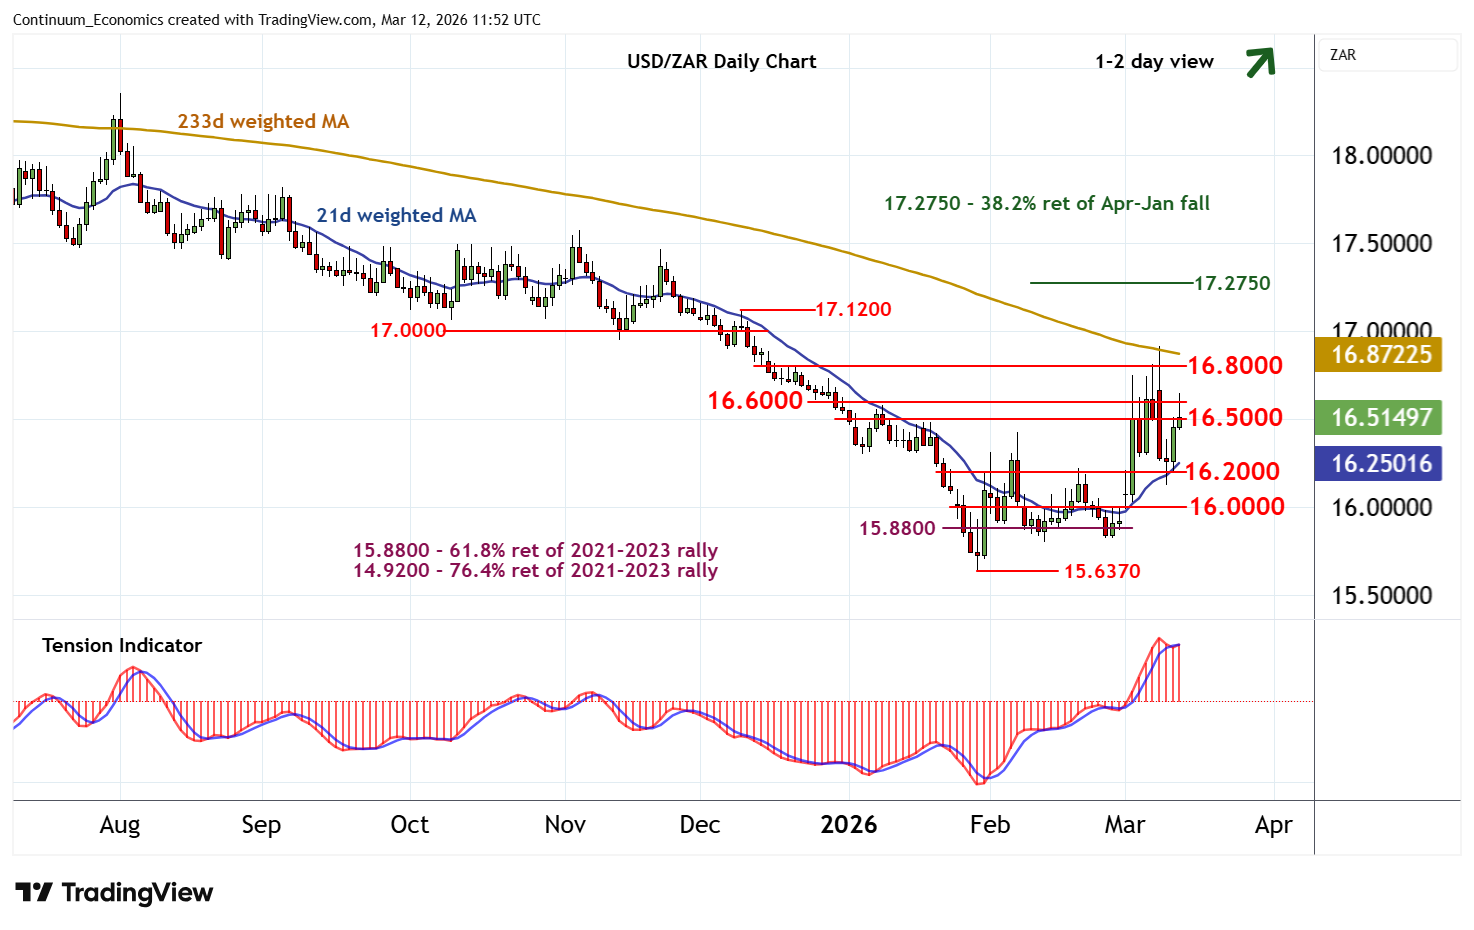
The anticipated test of resistance at the 16.5000 break level has extended above further resistance at 16.6000
| Level | Comment | Level | Comment | |||||
|---|---|---|---|---|---|---|---|---|
| R4 | 16.9170 | 9 Mar high | S1 | 16.2000 | * | congestion | ||
| R3 | 16.8000 | * | break level | S2 | 16.0000 | ** | congestion | |
| R2 | 16.6000 | break level | S3 | 15.8030 | * | 12 Feb (m) low | ||
| R1 | 16.5000 | break level | S4 | 15.6370 | ** | 29 Jan YTD low |
Asterisk denotes strength of level
11:40 GMT - The anticipated test of resistance at the 16.5000 break level has extended above further resistance at 16.6000, before settling lower into fresh consolidation beneath 16.5000. Daily readings are mixed, suggesting a cautious tone and potential for further consolidation in the coming sessions. But broader weekly charts continue to rise, highlighting room for a later break above 16.5000 - 16.6000 towards 16.8000. Meanwhile, support remains down to congestion around 16.2000 and should underpin any immediate setbacks.