Published: 2025-07-22T08:20:56.000Z
Chart USD Index DXY Update: Potential for a minor test lower

Senior Technical Strategist
2
The anticipated test of 98.00 has given way to a break down to 97.70
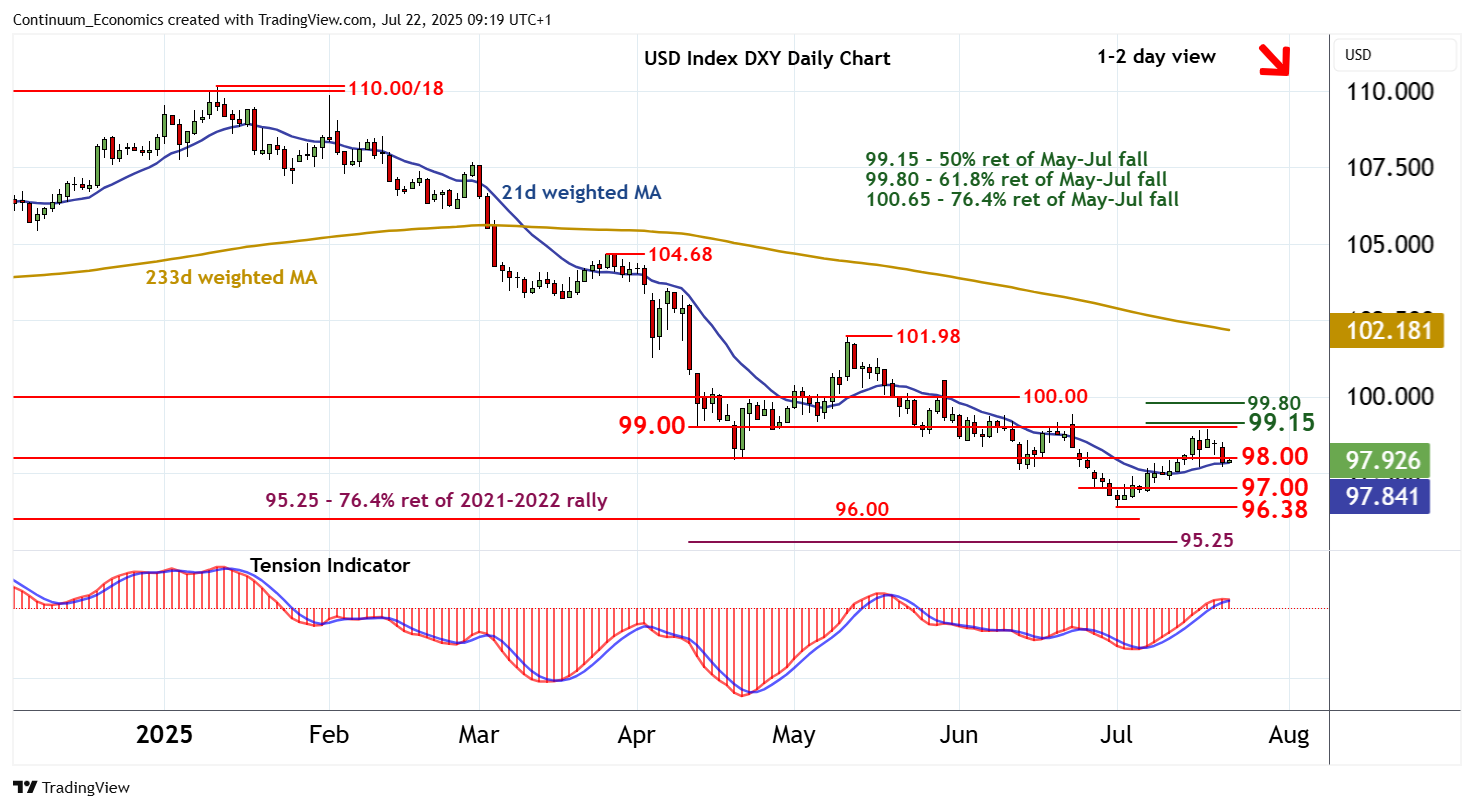
| Levels | Imp | Comment | Levels | Imp | Comment | |||
|---|---|---|---|---|---|---|---|---|
| R4 | 99.15 | ** | 50% ret of May-Jul fall | S1 | 97.00 | * | congestion | |
| R3 | 99.00 | break level | S2 | 96.50 | * | congestion | ||
| R2 | 98.95 | * | 17 Jul (w) high | S3 | 96.38 | * | 1 Jul YTD low | |
| R1 | 98.00 | * | congestion | S4 | 96.00 | * | congestion |
Asterisk denotes strength of level
09:00 BST - The anticipated test of 98.00 has given way to a break down to 97.70, where unwinding oversold intraday studies are prompting a bounce into fresh consolidation beneath 98.00. Daily stochastics are tracking lower, unwinding overbought areas, and the daily Tension Indicator is also turning down, highlighting room for further losses in the coming sessions. Support is next at congestion around 97.00. But rising weekly charts should limit any tests in fresh consolidation. Meanwhile, a close back above 98.00 would help to stabilise price action and prompt consolidation beneath 98.95/00.