Published: 2026-02-02T01:38:38.000Z
Chart GBP/USD Update: Lower to extend pullback from 1.3869 high
1
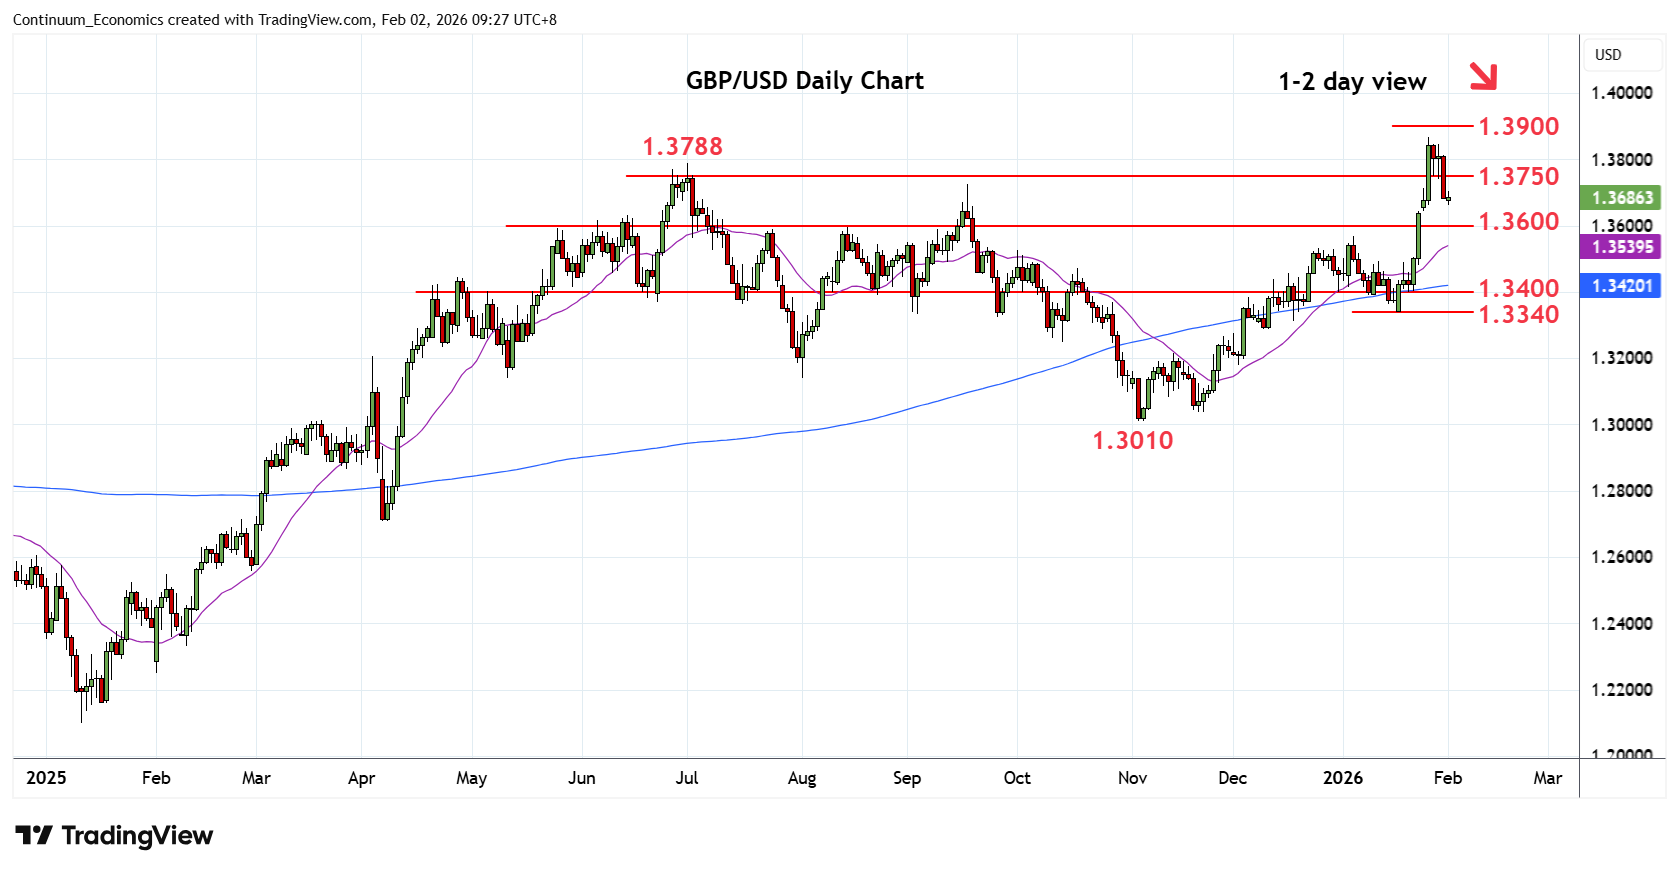
Extending pullback from the 1.3869 high as prices retrace strong gains from the 1.3340, January low
| Level | Comment | Level | Comment | |||||
|---|---|---|---|---|---|---|---|---|
| R4 | 1.3900/10 | * | congestion, Sep 2021 high | S1 | 1.3650 | * | congestion | |
| R3 | 1.3869 | ** | 27 Jan YTD high | S2 | 1.3600 | * | congestion | |
| R2 | 1.3800 | * | congestion | S3 | 1.3568 | ** | 6 Jan high | |
| R1 | 1.3750/88 | * | congestion, Jul high | S4 | 1.3500 | * | congestion |
Asterisk denotes strength of level
01:35 GMT - Extending pullback from the 1.3869 high as prices retrace strong gains from the 1.3340, January low. Prices are unwinding overbought intraday and daily studies and break of the 1.3700 level opens up room for deeper correction to 1.3650 congestion then the 1.3600/1.3568 area. Correction is expected to give way to renewed buying interest later with resistance now lowered to the 1.3750/88 area. Regaining this will return focus to the upside for retest of the 1.3800 level then the 1.3869 January high and where break extend the broader gains from 2022 year low.