Published: 2026-03-12T00:30:37.000Z
Chart AUD/USD Update: Consolidating below fresh year high
1
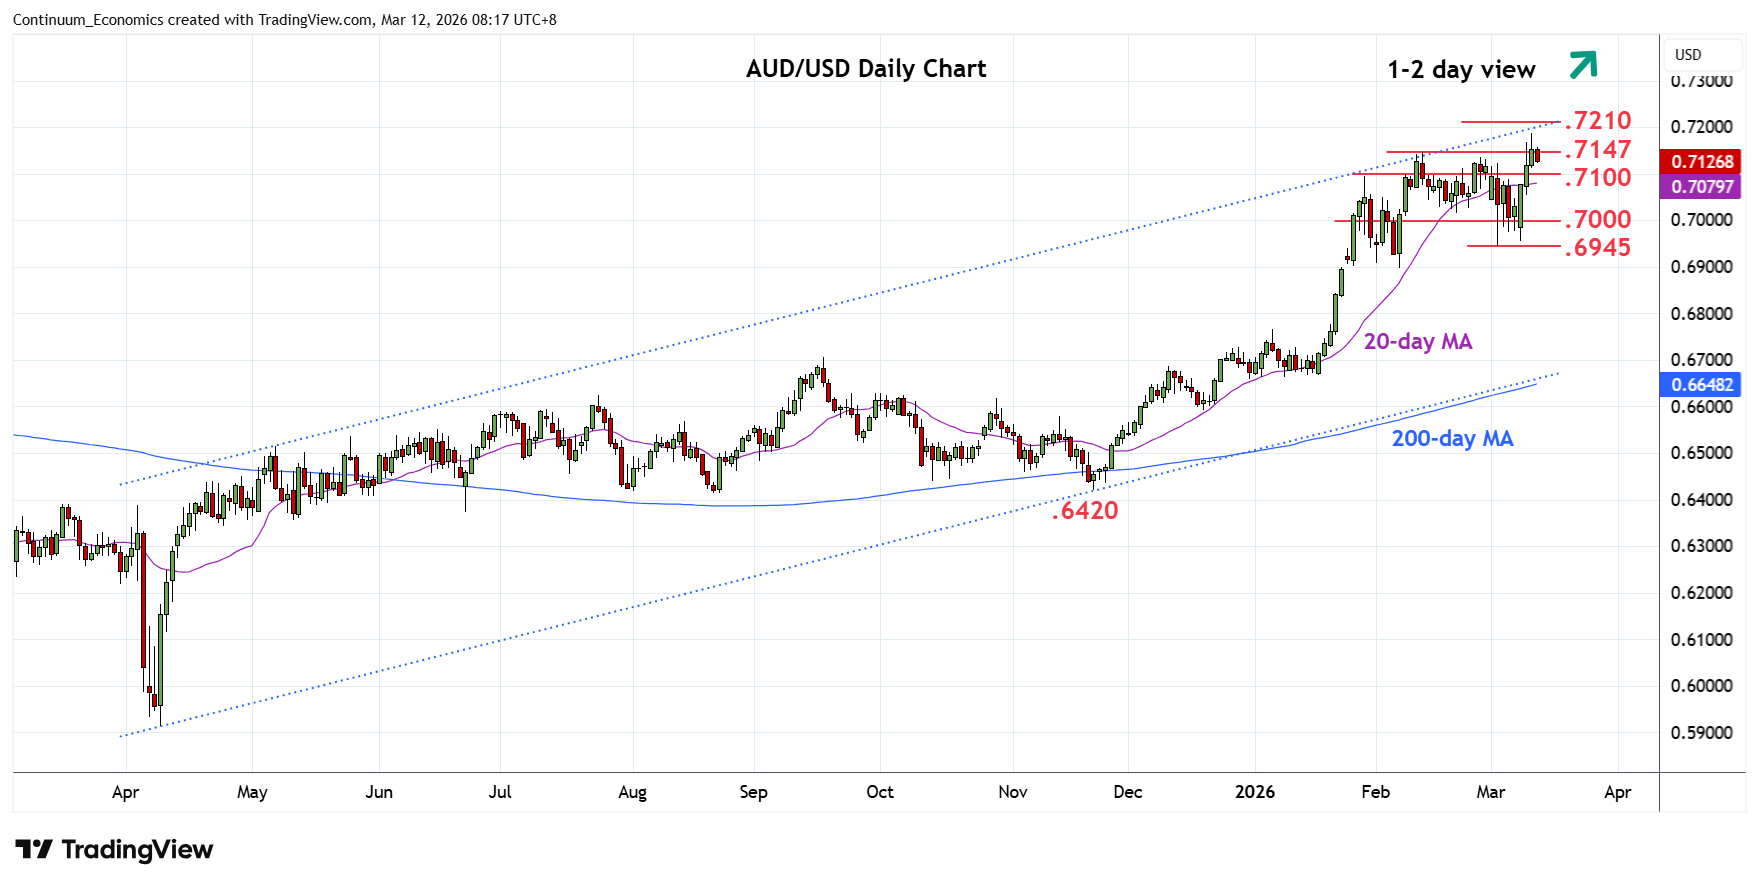
Lower in range from fresh year high at .7188 as prices consolidate gains from the Monday's .6956 low
| Levels | Imp | Comment | Levels | Imp | Comment | |||
|---|---|---|---|---|---|---|---|---|
| R4 | 0.7300 | * | congestion | S1 | 0.7100 | * | congestion | |
| R3 | 0.7285 | * | Jun 2022 high | S2 | 0.7050 | * | congestion | |
| R2 | 0.7200/10 | * | figure, 61.8% | S3 | 0.7015/00 | * | 20 Feb low, congestion | |
| R1 | 0.7188 | 11 Mar YTD high | S4 | 0.6945 | ** | 3 Mar low |
Asterisk denotes strength of level
00:20 GMT - Lower in range from fresh year high at .7188 as prices consolidate gains from the Monday's .6956 low. Pullback see prices unwind overbought intraday studies but bullish price structure keeps focus. Nearby see room to target the .7200/.7210 level and 61.8% Fibonacci level. Break here will extend the broader gains from the April low and see room to .7285/.7300 area. Meanwhile, support remains at the .7100 level. Would take break here to open up room for deeper pullback to strong support at the .7015/.7000 area which is expected to underpin.