Published: 2026-03-13T07:39:23.000Z
Chart AUD/JPY Update: Extending pullback from 113.95, fresh year high
-
Turned down from fresh year high at 113.95 and October channel resistance
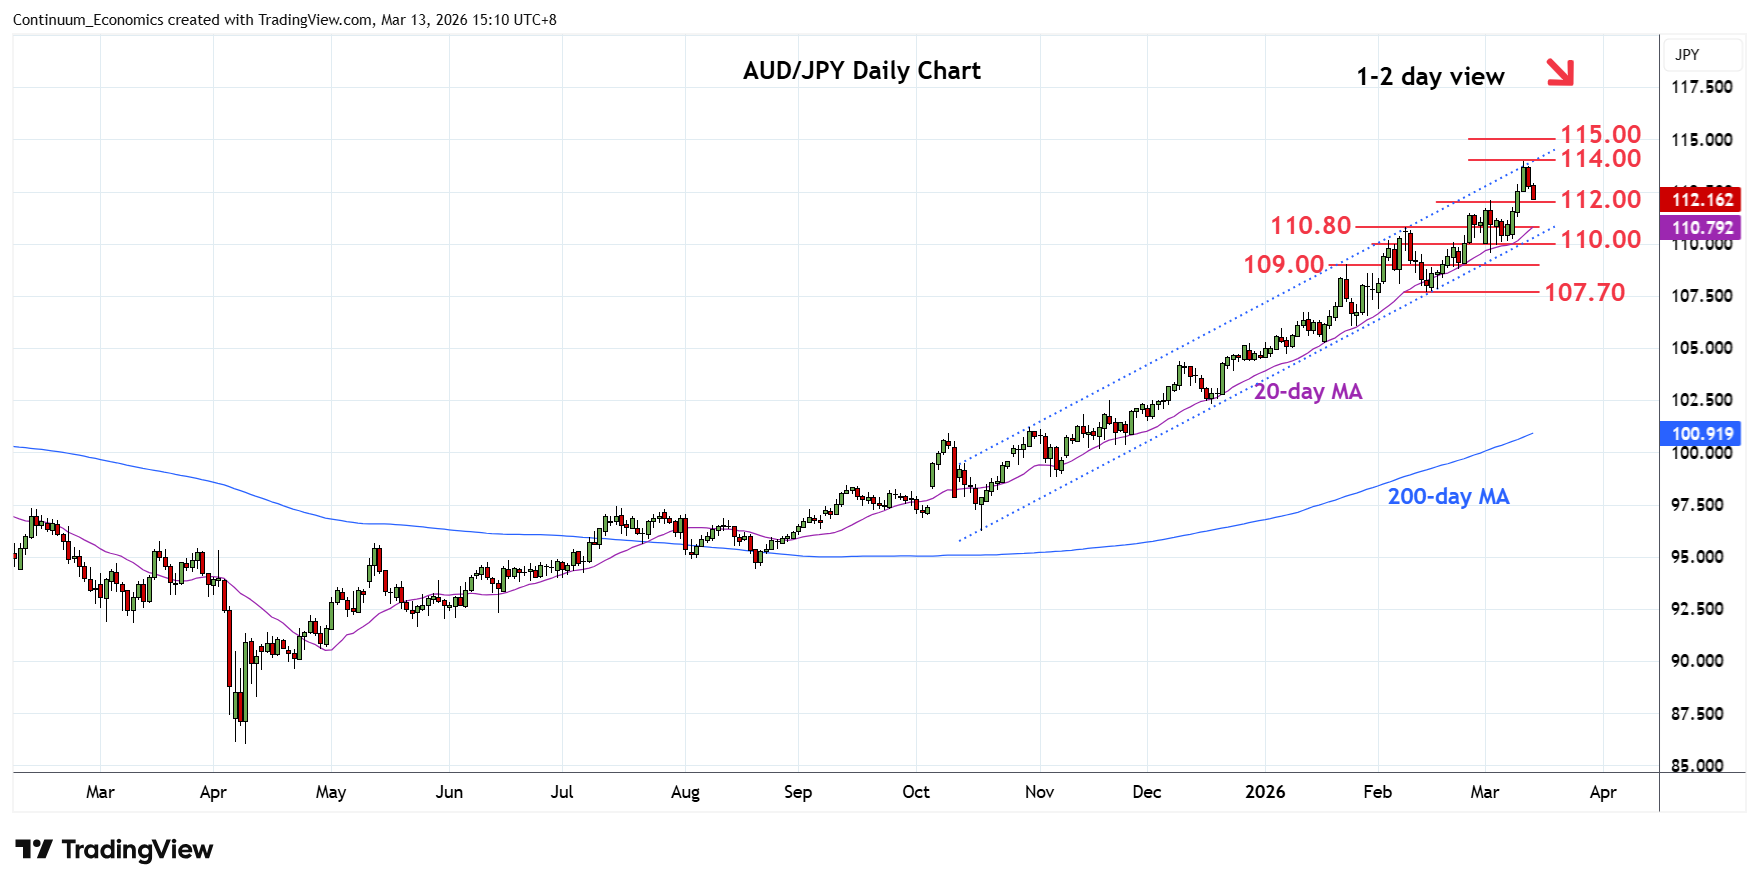
| Levels | Imp | Comment | Levels | Imp | Comment | |||
|---|---|---|---|---|---|---|---|---|
| R4 | 118.00 | * | congestion | S1 | 112.00 | * | 3 Mar high | |
| R3 | 116.00 | * | congestion | S2 | 110.80 | ** | 9 Feb high | |
| R2 | 115.00 | * | congestion | S3 | 110.00 | * | congestion | |
| R1 | 113.95 | * | 11 Mar YTD high | S4 | 109.35/00 | ** | 2024 yr high, Jan high |
Asterisk denotes strength of level
07:30 GMT - Turned down from fresh year high at 113.95 and channel resistance from the October low as prices unwind overbought intraday and daily studies. Pullback see support at the 112.00 high of 3 March. Would take break here to open up room for deeper correction to strong support at the 110.80 /110.00 congestion area. Break here will open up room to strong support at 109.35/109.00, 2024 year high and January high. Meanwhile, resistance at the 113.95 high now expected to cap.