Chart USD/CAD Update: Consolidating break above 1.4000
The anticipated break above 1.4000 has reached 1.4080, where unwinding overbought intraday studies are prompting short-term reactions
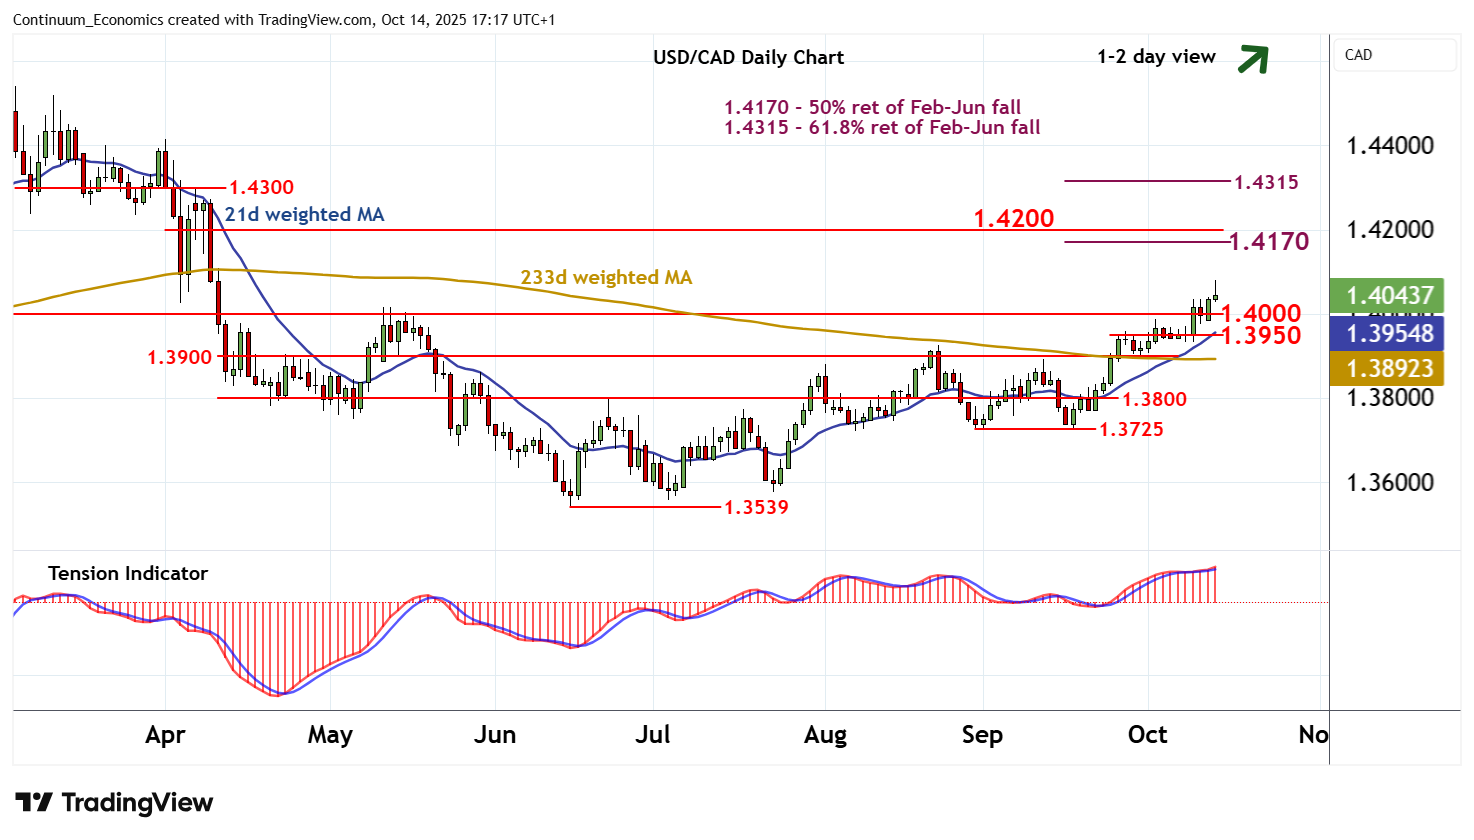
| Levels | Imp | Comment | Levels | Imp | Comment | |||
|---|---|---|---|---|---|---|---|---|
| R4 | 1.4300 | * | congestion | S1 | 1.4000 | * | break level | |
| R3 | 1.4200 | ** | break level | S2 | 1.3950 | * | pivot | |
| R2 | 1.4170 | ** | 50% ret of Feb-Jun fall | S3 | 1.3900 | ** | break level | |
| R1 | 1.4080 | current day high | S4 | 1.3800 | * | congestion |
Asterisk denotes strength of level
16:45 BST - The anticipated break above 1.4000 has reached 1.4080, where unwinding overbought intraday studies are prompting short-term reactions. Overbought daily stochastics are flattening, suggesting potential for consolidation, before the rising daily Tension Indicator and positive weekly charts extend June gains still further. A break above 1.4080 will open up the 1.4170 Fibonacci retracement. But already overbought weekly stochastics could limit any initial tests in profit-taking/consolidation. Meanwhile, a close back below 1.4000 will turn sentiment neutral and put focus on 1.3950.