Published: 2026-02-20T00:37:18.000Z
Chart NZD/USD Update: Consolidating test of .5950 support
1
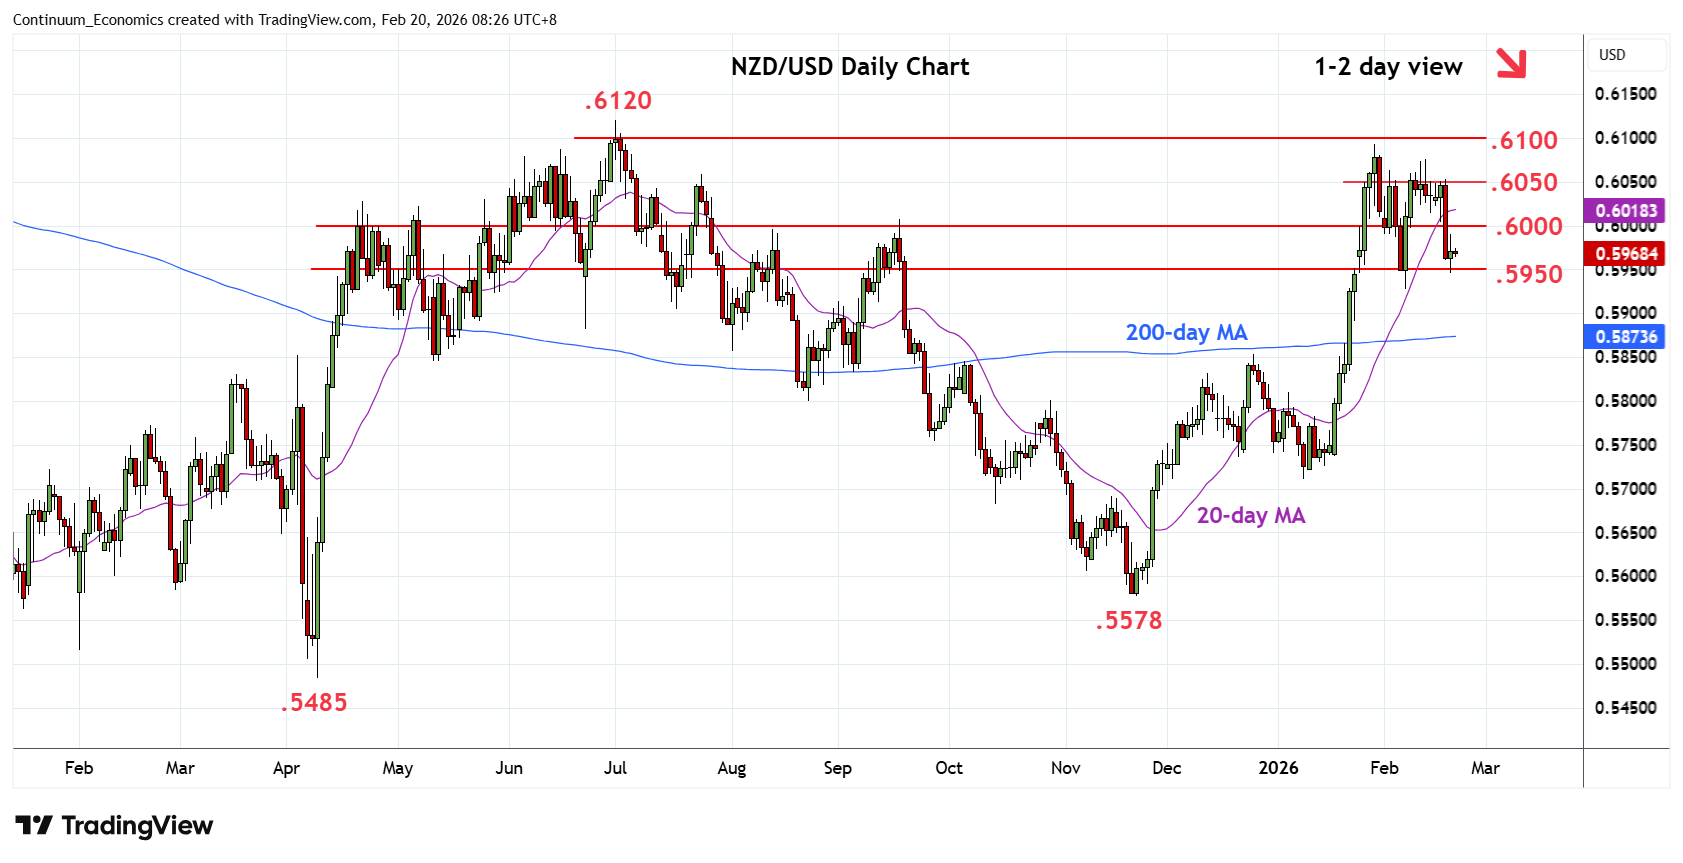
Consolidating test of support at the .5950 congestion but pressure remains on the downside
| Levels | Imp | Comment | Levels | Imp | Comment | |||
|---|---|---|---|---|---|---|---|---|
| R4 | .6093 | ** | 29 Jan YTD high | S1 | .5950 | * | congestion | |
| R3 | .6076 | * | 12 Feb high | S2 | .5928 | ** | 6 Feb low | |
| R2 | .6050 | * | congestion | S3 | .5900 | * | 38.2% Nov/Jan rally | |
| R1 | .6000 | * | figure, congestion | S4 | .5853/50 | ** | Dec high, congestion |
Asterisk denotes strength of level
00:30 GMT - Consolidating test of support at the .5950 congestion but pressure remains on the downside and see risk for break here to extend pullback from the .6076 high of last week. Break will expose the 6 February swing low at .5928 to retest. Below this will see room for deeper pullback to retrace the November/January rally and see scope to target the .5900 level and 38.2% Fibonacci level. Meanwhile, resistance is lowered to the .6000 congestion. Would need to regain this to ease the downside pressure and further extend consolidation within .6100/.5950 area.