Published: 2025-12-04T07:40:25.000Z
Chart GBP/JPY Update: Pressuring 207.20, November YTD high
-
Bounce from the 205.30 support see pressure returning to the 207.20, November current year high
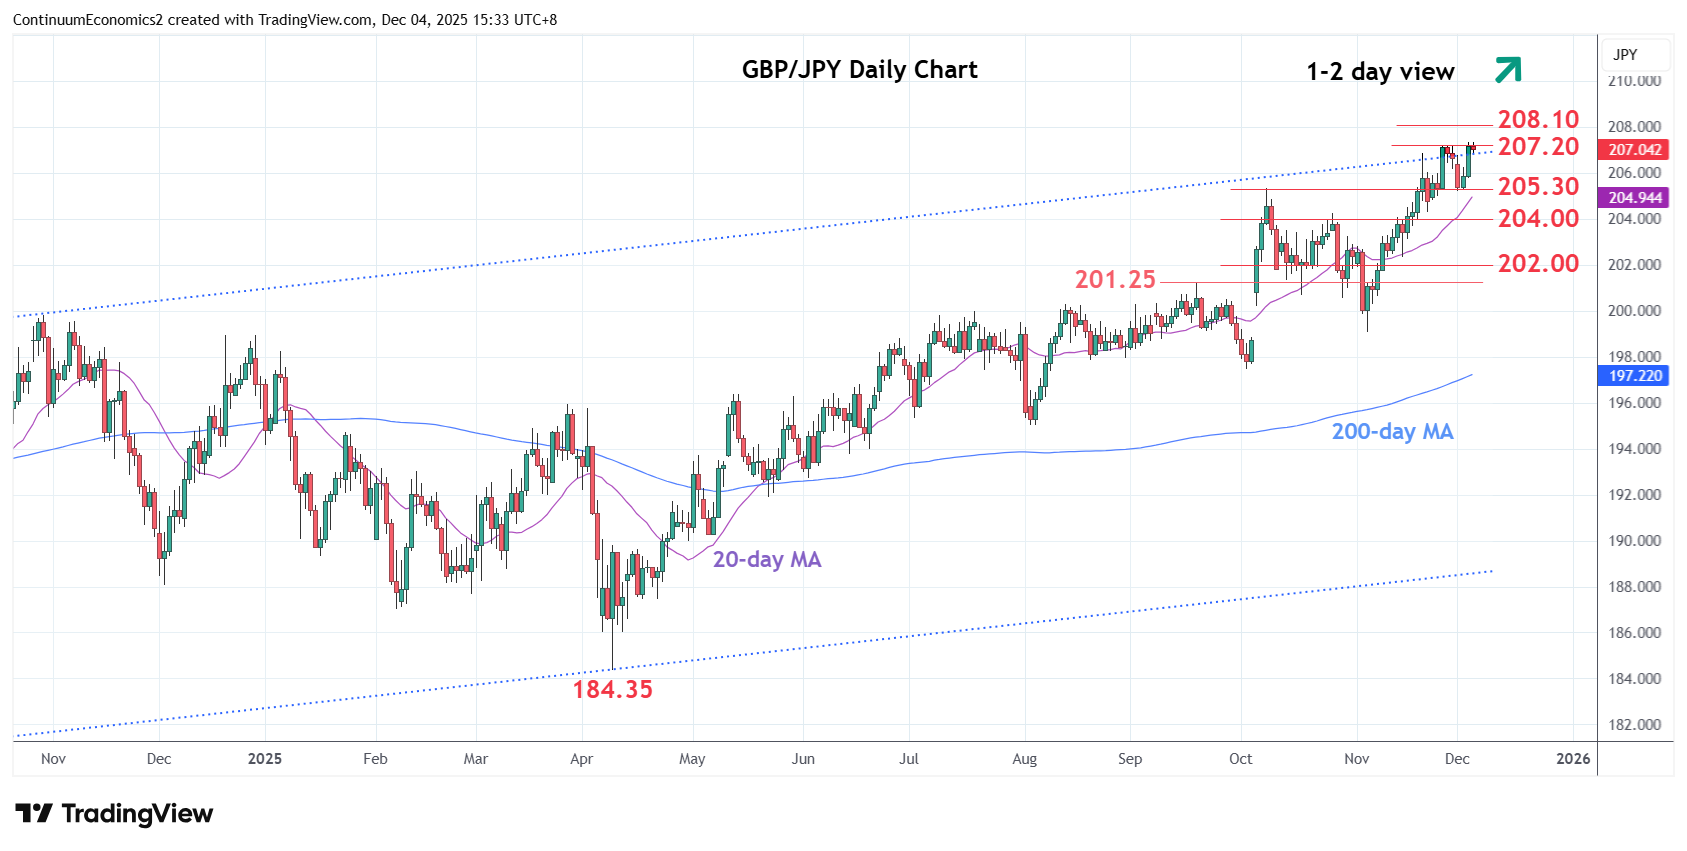
| Levels | Imp | Comment | Levels | Imp | Comment | |||
|---|---|---|---|---|---|---|---|---|
| R4 | 212.00 | * | congestion | S1 | 205.30 | * | Oct high | |
| R3 | 210.00 | * | congestion | S2 | 204.00 | * | congestion | |
| R2 | 208.10 | ** | Jul 2024 multi-year high | S3 | 202.30/00 | * | 11 Nov low, congestion | |
| R1 | 207.20 | * | 26 Nov YTD high | S4 | 201.25 | ** | Sep high |
Asterisk denotes strength of level
07:40 GMT - Bounce from the 205.30 support see pressure returning to the 207.20, November current year high. Bullish gains from the April current year low at 184.35 suggest scope for break higher to open up room for extension to target the 208.10, July 2024 multi-year high. Higher still, if seen, will see potential to the 210.00/212.00 congestion area. Meanwhile, support is at the 205.30 October high and this extend to the 204.00 congestion which should underpin and limit corrective pullback. Break here will fade the upside pressure and see room for deeper correction to the 202.00/201.25 support.