Published: 2026-05-07T07:29:45.000Z
Chart GBP/USD Update: Studies continue to improve
4
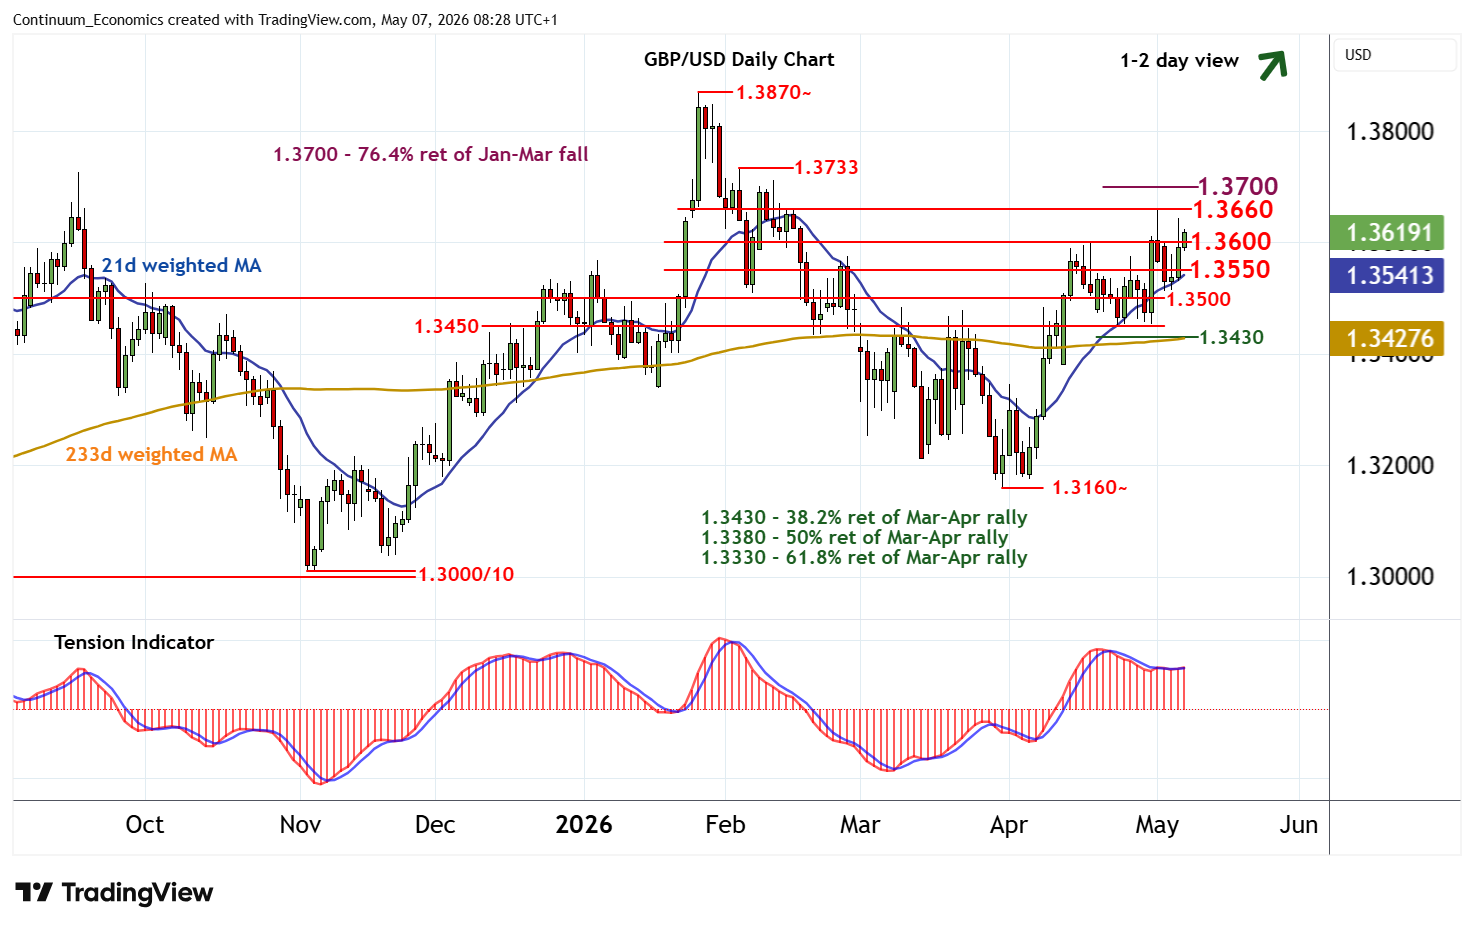
Little change, as prices extend consolidation following the test of congestion resistance at 1.3660
| Level | Comment | Level | Comment | |||||
|---|---|---|---|---|---|---|---|---|
| R4 | 1.3750 | * | congestion | S1 | 1.3600 | * | congestion | |
| R3 | 1.3733 | * | 4 Feb (m) high | S2 | 1.3550 | * | congestion | |
| R2 | 1.3700 | ** | 76.4% ret of Jan-Mar fall | S3 | 1.3500 | ** | congestion | |
| R1 | 1.3660 | * | congestion | S4 | 1.3450 | break level |
Asterisk denotes strength of level
08:10 BST - Little change, as prices extend consolidation following the test of congestion resistance at 1.3660. Daily readings continue to show signs of improvement and broader weekly charts are rising, highlighting room for a later break above 1.3660 and extension of late-March gains initially towards strong resistance at the 1.3700 Fibonacci retracement. Meanwhile, support remains at congestion around 1.3600. A close beneath here would stabilise price action and prompt fresh consolidation above further congestion around 1.3550.