Published: 2026-04-22T16:10:30.000Z
Chart USD/CAD Update: Extending consolidation
2
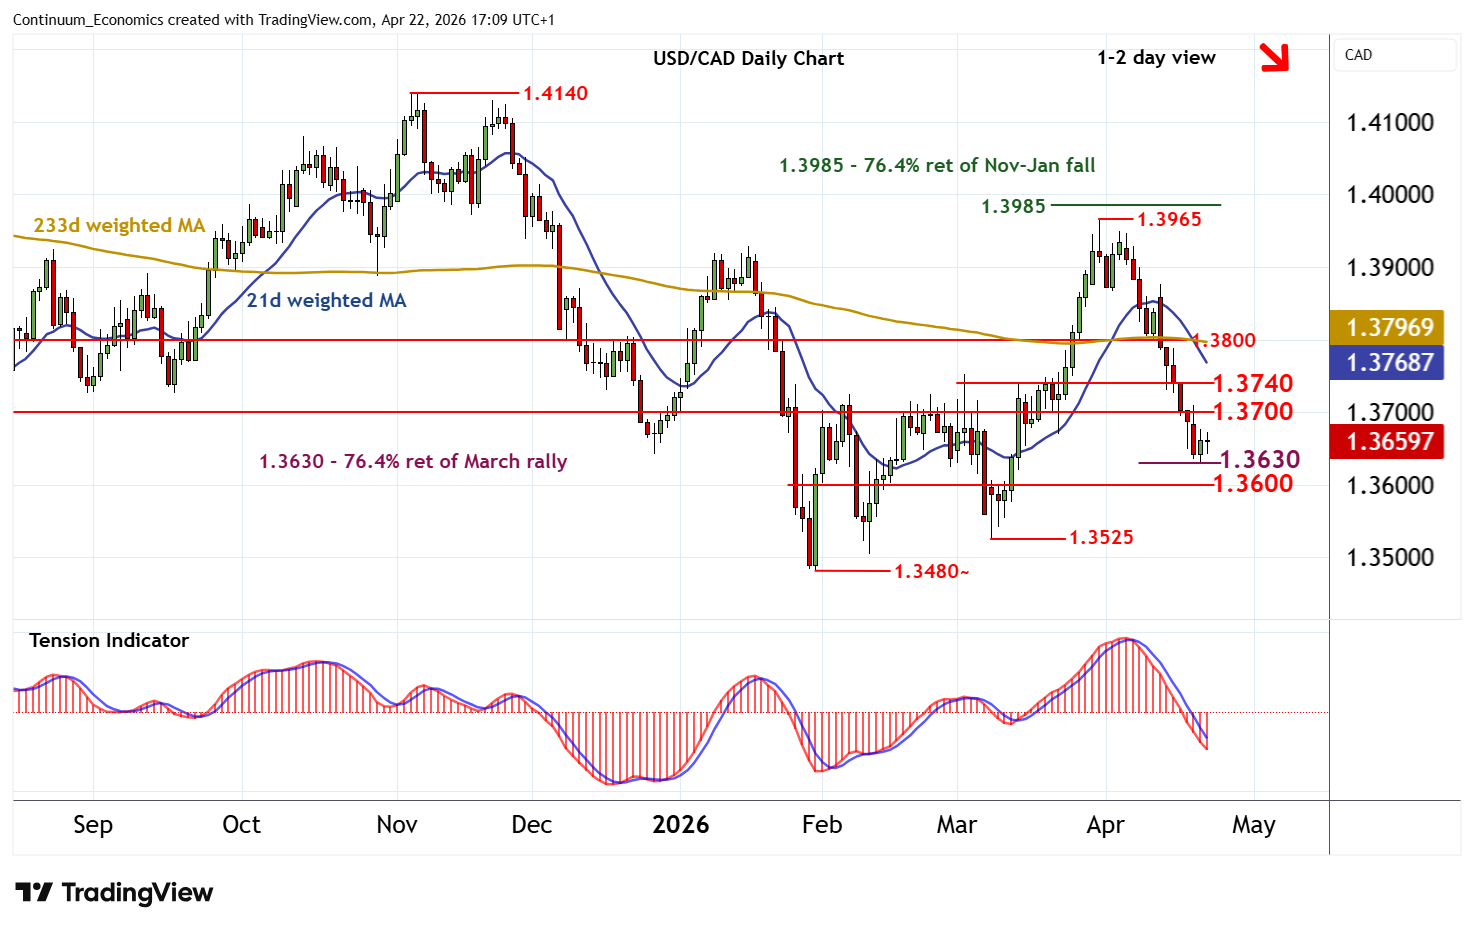
Little change, as prices extend cautious trade around 1.3650
| Levels | Imp | Comment | Levels | Imp | Comment | |||
|---|---|---|---|---|---|---|---|---|
| R4 | 1.3850 | * | congestion | S1 | 1.3630 | ** | 76.4% ret of March rally | |
| R3 | 1.3800 | * | congestion | S2 | 1.3600 | ** | congestion | |
| R2 | 1.3740 | * | break level | S3 | 1.3525 | * | 9 Mar (m) low | |
| R1 | 1.3700 | ** | congestion | S4 | 1.3480~ | ** | 30 Jan YTD low |
Asterisk denotes strength of level
16:55 BST - Little change, as prices extend cautious trade around 1.3650. The daily Tension Indicator continues to track lower and broader weekly charts are falling, highlighting room for further losses in the coming sessions. A close below support at the 1.3630 Fibonacci retracement will add weight to sentiment and extend late-March losses towards congestion around 1.3600. Meanwhile, resistance remains at congestion around 1.3700. A close above here, would help to stabilise price action and prompt consolidation beneath the 1.3740 break level.