Published: 2026-05-05T00:26:15.000Z
Chart AUD/USD Update: Lower in consolidation from .7228 high
-
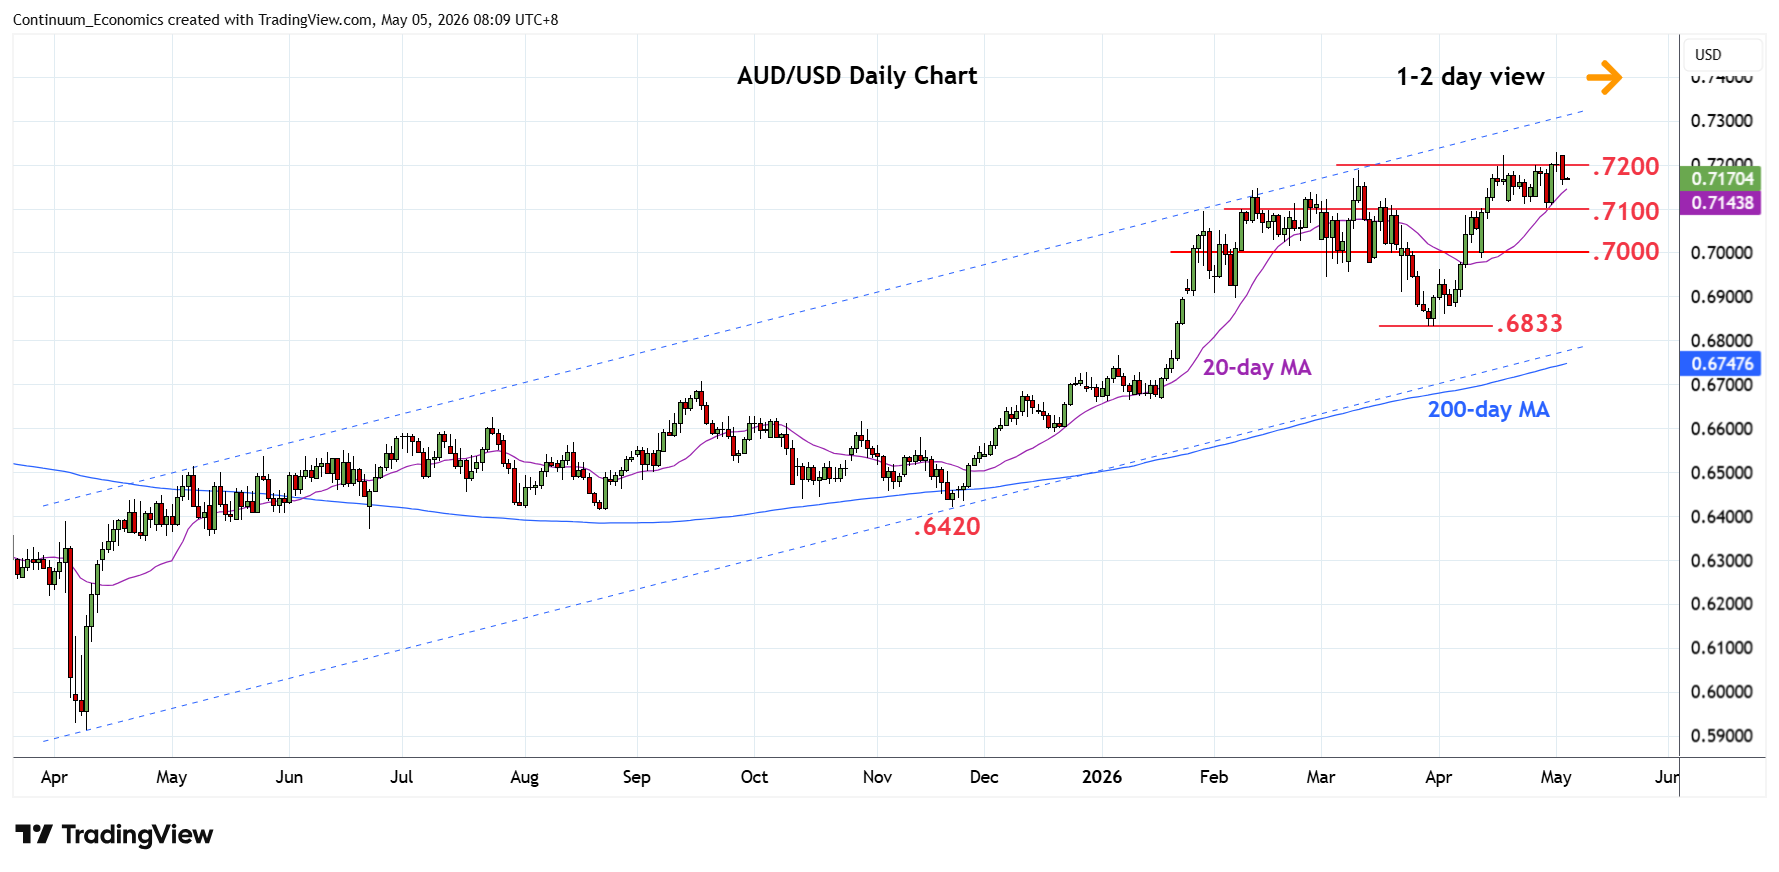
No follow-through on break above the .7200 level as prices settled back from the .7228 Friday's current year high
| Levels | Imp | Comment | Levels | Imp | Comment | |||
|---|---|---|---|---|---|---|---|---|
| R4 | 0.7400 | * | congestion | S1 | 0.7150 | * | congestion | |
| R3 | 0.7300 | * | congestion | S2 | 0.7110/00 | ** | 23 Apr low, congestion | |
| R2 | 0.7280 | * | Jun 2022 high | S3 | 0.7050 | * | congestion | |
| R1 | 0.7228 | ** | 1 May YTD high | S4 | 0.7000 | ** | figure, congestion |
Asterisk denotes strength of level
00:15 GMT - No follow-through on break above the .7200 level as prices settled back from the .7228 Friday's current year high. Pullback see prices back in consolidation within the .7200/.7100 area but negative daily studies threatens retest of the .7110/.7100 support. Break here will open up room for deeper pullback to retrace recent strong gains from the .6833 March low and see room to support at the .7050/.7000 congestion area. Meanwhile, resistance is at the .7200/28 area. Would take break here to extend gains from the 2025 year low to target the June 2022 high at .7280 then the .7300 level.