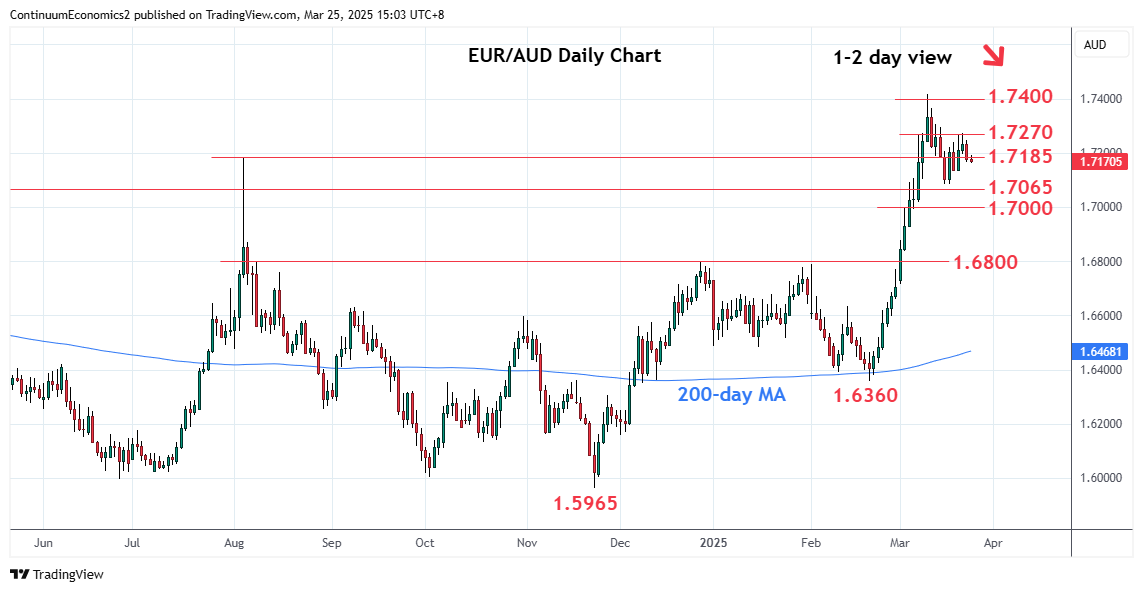
Turned up from test of the 1.7100 level as prices consolidate losses from the 1.7418, 11 March YTD high

| Levels | Imp | Comment | Levels | Imp | Comment | |||
|---|---|---|---|---|---|---|---|---|
| R4 | 1.7600 | congestion | S1 | 1.7100 | congestion | |||
| R3 | 1.7505 | * | 9 Apr 2020 high | S2 | 1.7065 | ** | Aug 2023 year high | |
| R2 | 1.7418 | ** | 11 Mar YTD high | S3 | 1.7000 | * | congestion | |
| R1 | 1.7270/00 | * | 7 Mar high, congestion | S4 | 1.6880 | * | 3 Mar high |
Asterisk denotes strength of level
07:30 GMT - Turned up from test of the 1.7100 level as prices consolidate losses from the 1.7418, 11 March YTD high. The resulting flag pattern highlights risk for retest of the 1.7100 level and where break will trigger deeper pullback to retrace sharp rally from the 1.6360, February YTD low. Lower will see room to the 1.7065 support and 1.7000 congestion. Meanwhile, resistance at the 1.7270/1.7300 area expected to cap and sustain losses from the 1.7418 high.