Chart GBP/USD Update: Consolidating - background studies rising

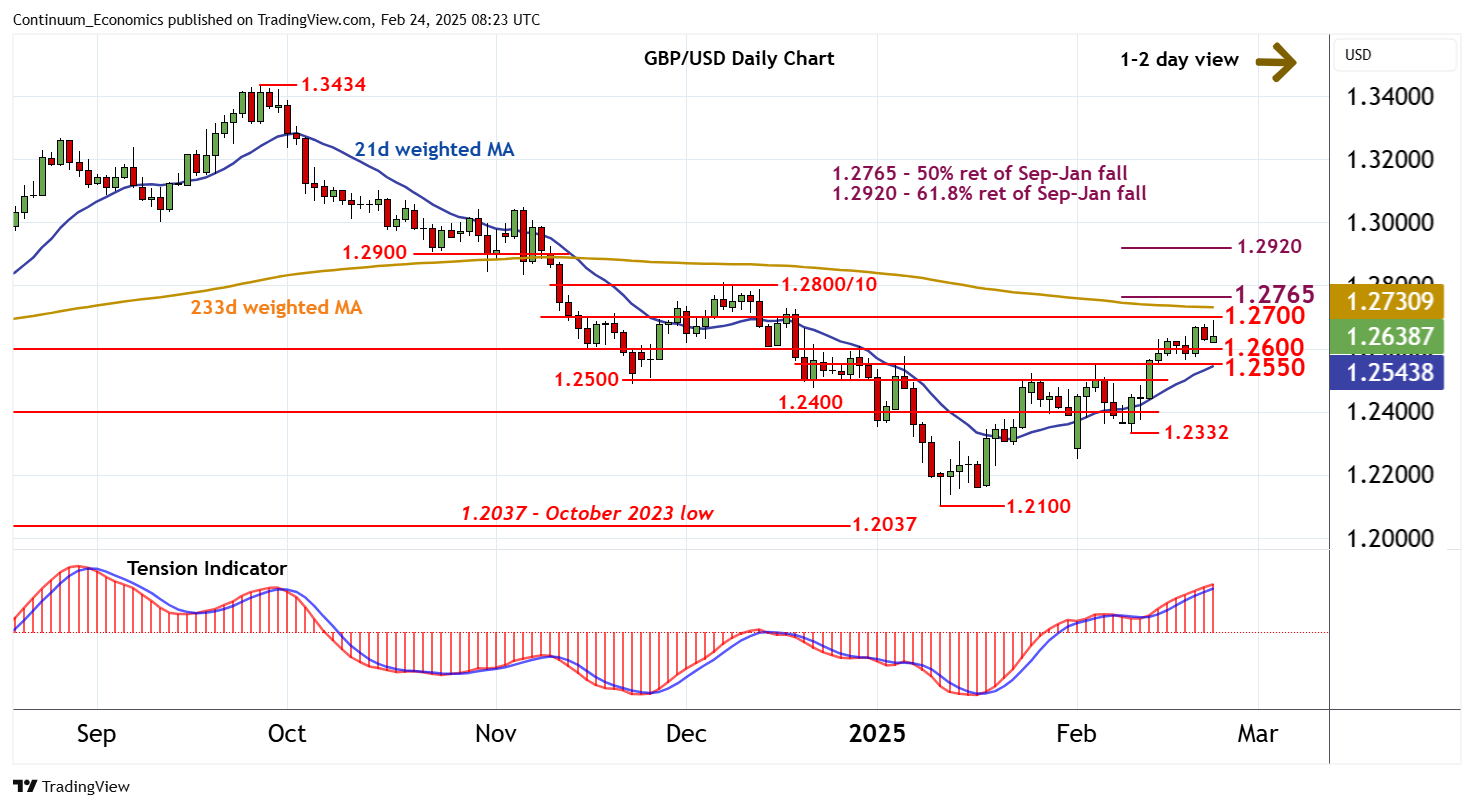
Little change, as prices extend cautious trade beneath congestion resistance at 1.2700
| Level | Comment | Level | Comment | |||||
|---|---|---|---|---|---|---|---|---|
| R4 | 1.2900 | * | break level | S1 | 1.2600 | * | congestion | |
| R3 | 1.2800/10 | ** | congestion; 6 Dec (m) high | S2 | 1.2550 | * | break level | |
| R2 | 1.2765 | ** | 50% ret of Sep-Jan fall | S3 | 1.2500 | * | break level | |
| R1 | 1.2700 | * | congestion | S4 | 1.2450 | break level |
Asterisk denotes strength of level
08:10 GMT - Little change, as prices extend cautious trade beneath congestion resistance at 1.2700. Intraday studies are turning down, highlighting potential for a move down to congestion support at 1.2600. But positive daily readings and bullish weekly charts are expected to limit any break in renewed buying interest towards 1.2550. A close beneath here, however, would add weight to sentiment and extend corrective losses initially towards 1.2500. Following cautious trade, higher levels are looked for. A later break above 1.2700 will extend January gains towards the 1.2765 Fibonacci retracement. But already overbought daily stochastics are expected to prompt profit-taking towards here and limit any initial tests in fresh consolidation.