Chart EUR/GBP Update: Under pressure

The anticipated minor test above congestion resistance at 0.8300 has not been seen
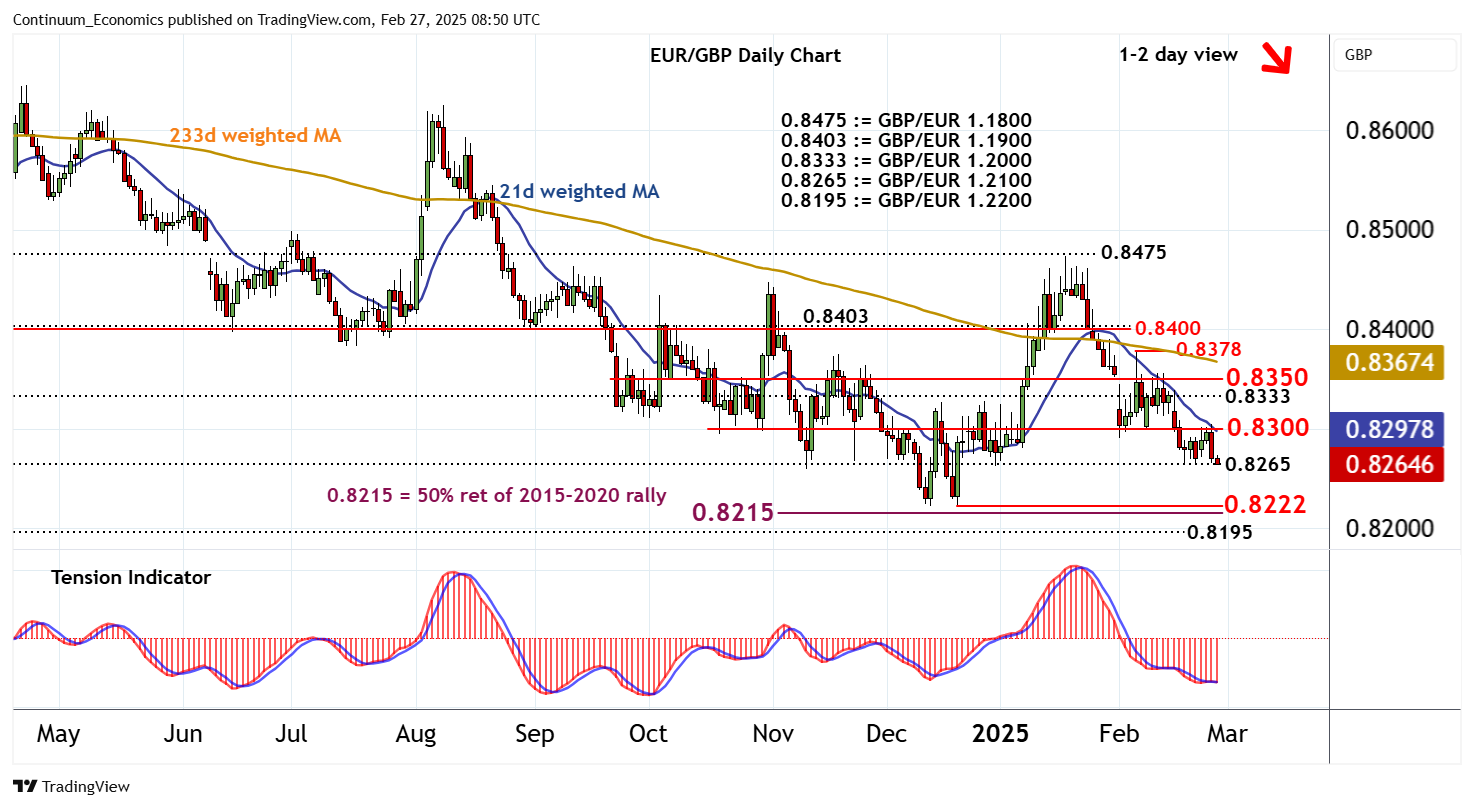
| Level | Comment | Level | Comment | |||||
|---|---|---|---|---|---|---|---|---|
| R4 | 0.8378 | * | 6 Feb (w) high | S1 | 0.8265 | * | GBP/EUR 1.2100 | |
| R3 | 0.8350 | ** | congestion | S2 | 0.8222 | ** | 19 Dec 2024 (y) low | |
| R2 | 0.8333 | * | GBP/EUR 1.2000 | S3 | 0.8215 | ** | 50% ret of 2015-2020 rally | |
| R1 | 0.8300 | ** | congestion | S4 | 0.8195/00 | ** | GBP/EUR 1.2200; figure |
Asterisk denotes strength of level
08:40 GMT - The anticipated minor test above congestion resistance at 0.8300 has not been seen, as prices drift lower in EUR-driven trade to pressure support at 0.8265, (GBP/EUR 1.2100). Daily readings have ticked lower and broader weekly charts are under pressure, highlighting room for a break beneath here and extension of January losses towards strong supports at the 0.8222 year low of 19 December 2024 and the 0.8215 Fibonacci retracement. By-then oversold daily stochastics are expected to limit any initial tests of this area in renewed consolidation. Meanwhile, resistance at 0.8300 should continue to cap any immediate tests higher.