Published: 2025-10-15T07:33:10.000Z
Chart GBP/USD Update: Back in range
5
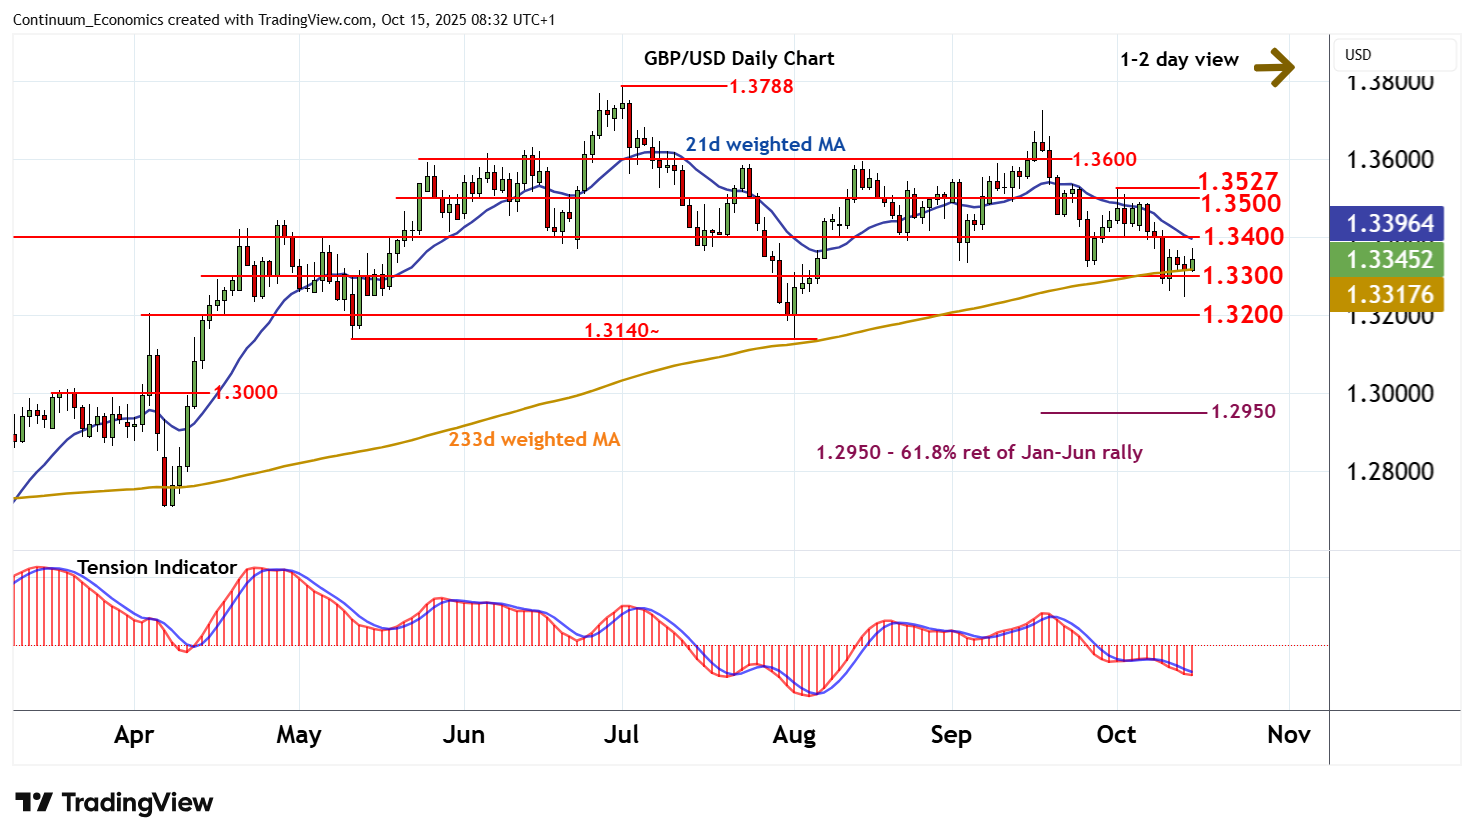
Anticipated losses have proven shallow
| Level | Comment | Level | Comment | |||||
|---|---|---|---|---|---|---|---|---|
| R4 | 1.3527 | ** | 1 Oct (w) high | S1 | 1.3300 | * | congestion | |
| R3 | 1.3500 | * | congestion | S2 | 1.3248 | 14 Oct low | ||
| R2 | 1.3400 | * | congestion | S3 | 1.3200 | * | congestion | |
| R1 | 1.3370 | 10 Oct high | S4 | 1.3140 | ** | May-Aug lows |
Asterisk denotes strength of level
08:10 BST - Anticipated losses have proven shallow, with prices bouncing smartly from 1.3248 to reach the 1.3370 high of 10 October, before settling lower. Rising intraday studies highlight room for continuation towards congestion resistance at 1.3400. But mixed daily readings and negative weekly charts should limit any tests in selling interest/consolidation. A close above here, if seen, should give way to consolidation beneath 1.3500/27. Following cautious trade, fresh losses are looked for. A close below 1.3300 will add weight to sentiment and extend mid-September losses towards further congestion around 1.3200.