Published: 2026-02-26T07:27:05.000Z
Chart EUR/AUD Update: Extending losses, but stretched
1
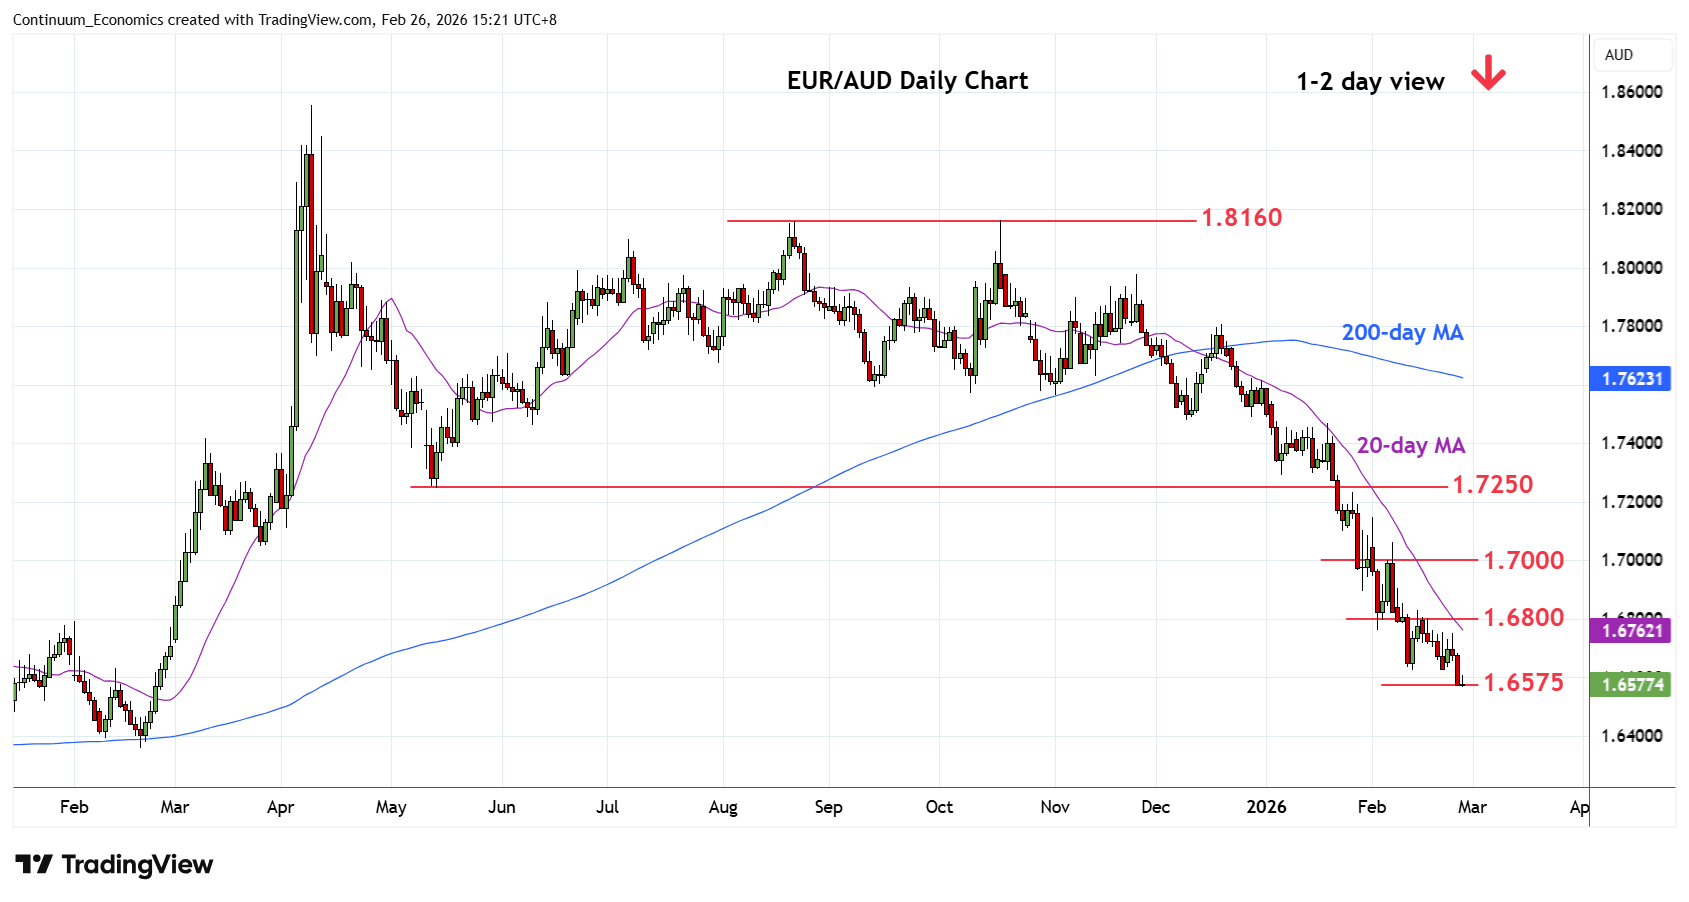
Break of the 1.6625 low of 12 February has seen extension to reach fresh year low at the 1.6575, 76.4% Fibonacci level
| Levels | Imp | Comment | Levels | Imp | Comment | |||
|---|---|---|---|---|---|---|---|---|
| R4 | 1.7000 | * | figure, congestion | S1 | 1.6575 | * | 76.4% 2024/2025 rally | |
| R3 | 1.6900 | * | congestion | S2 | 1.6500 | * | congestion | |
| R2 | 1.6800 | * | congestion | S3 | 1.6400 | * | congestion | |
| R1 | 1.6760 | * | 3 Feb low | S4 | 1.6357 | ** | Feb 2025 year low |
Asterisk denotes strength of level
07:25 GMT - Break of the 1.6625 low of 12 February has seen extension to reach fresh year low at the 1.6575, 76.4% Fibonacci level. Below this will further extend losses from the April 2025 year high and see extension to the 1.6500/1.6400 congestion area. However, oversold daily and weekly studies caution corrective bounce. Resistance remains at the 1.6760/1.6800 recent low and congestion area. Would need lift over this to ease the downside pressure and clear the way for corrective bounce to retrace sharp losses from the January high.