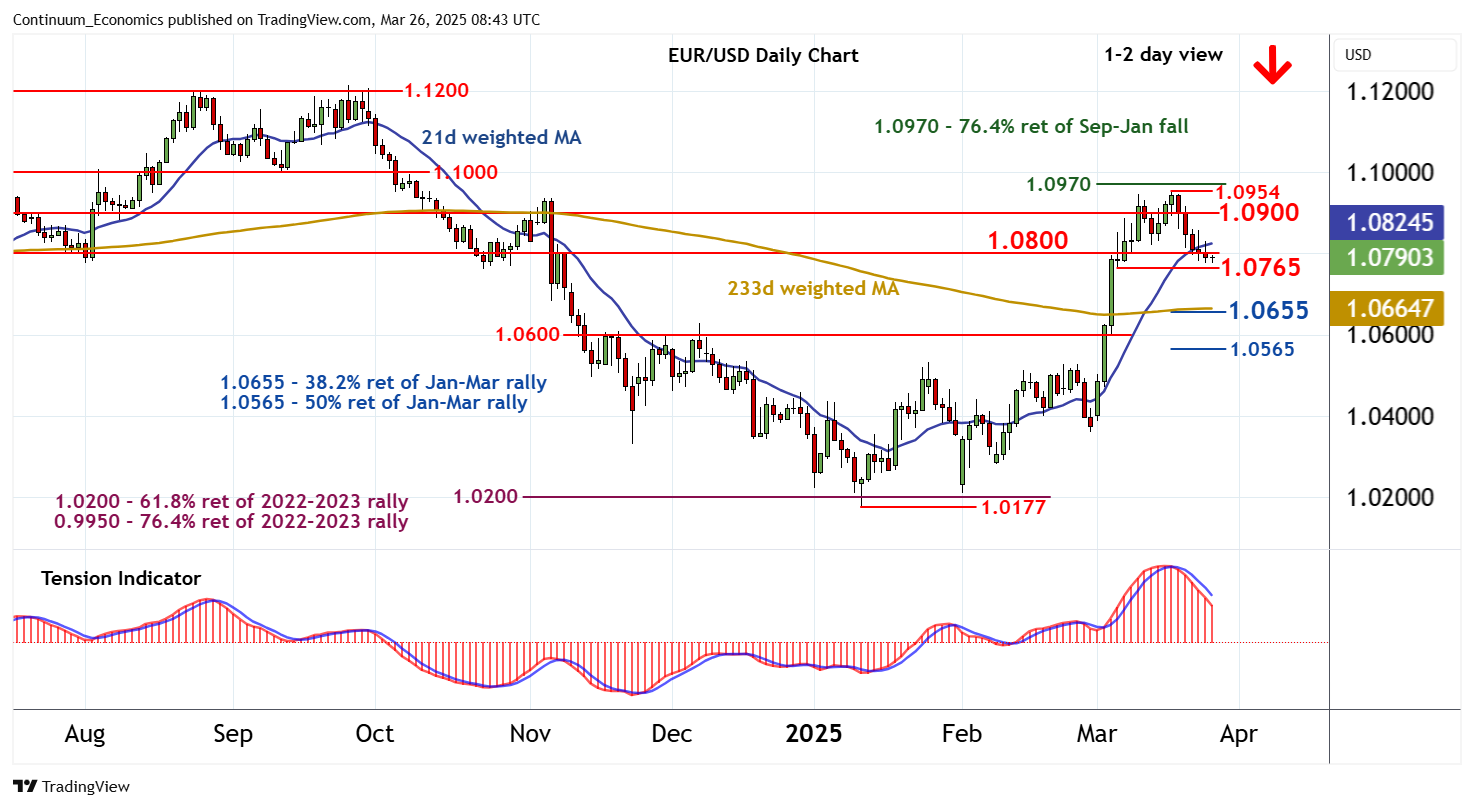
Chart EUR/USD Update: Drifting lower

Little change, as mixed intraday studies keep near-term sentiment cautious

| Levels | Imp | Comment | Levels | Imp | Comment | |||
|---|---|---|---|---|---|---|---|---|
| R4 | 1.0970 | ** | 76.4% ret of Sep-Jan fall | S1 | 1.0765 | * | 6 Mar low | |
| 14 | 1.0954 | 18 Mar YTD high | S2 | 1.0655 | ** | 38.2% ret of Jan-Mar rally | ||
| R2 | 1.0900 | * | break level | S3 | 1.0600 | ** | congestion | |
| R1 | 1.0800 | * | break level | S4 | 1.0565 | ** | 50% ret of Jan-Mar rally |
Asterisk denotes strength of level
08:35 GMT - Little change, as mixed intraday studies keep near-term sentiment cautious and extend consolidation within the 1.0765 - 1.0800 range. Daily readings are mixed/negative, putting focus on 1.0765, with room for a later break beneath here as overbought weekly stochastics also flatten. A close below the 1.0765 low of 6 March will add weight to price action and extend March losses towards the 1.0655 Fibonacci retracement. The rising weekly Tension Indicator, however, could prompt fresh buying interest towards here. Meanwhile, a close back above the 1.0800 break level, if seen, would help to stabilise price action once again and give way to renewed consolidation beneath the 1.0900 break level.