Published: 2026-04-13T13:29:21.000Z
Chart AUD/USD Update: Choppy trade
1
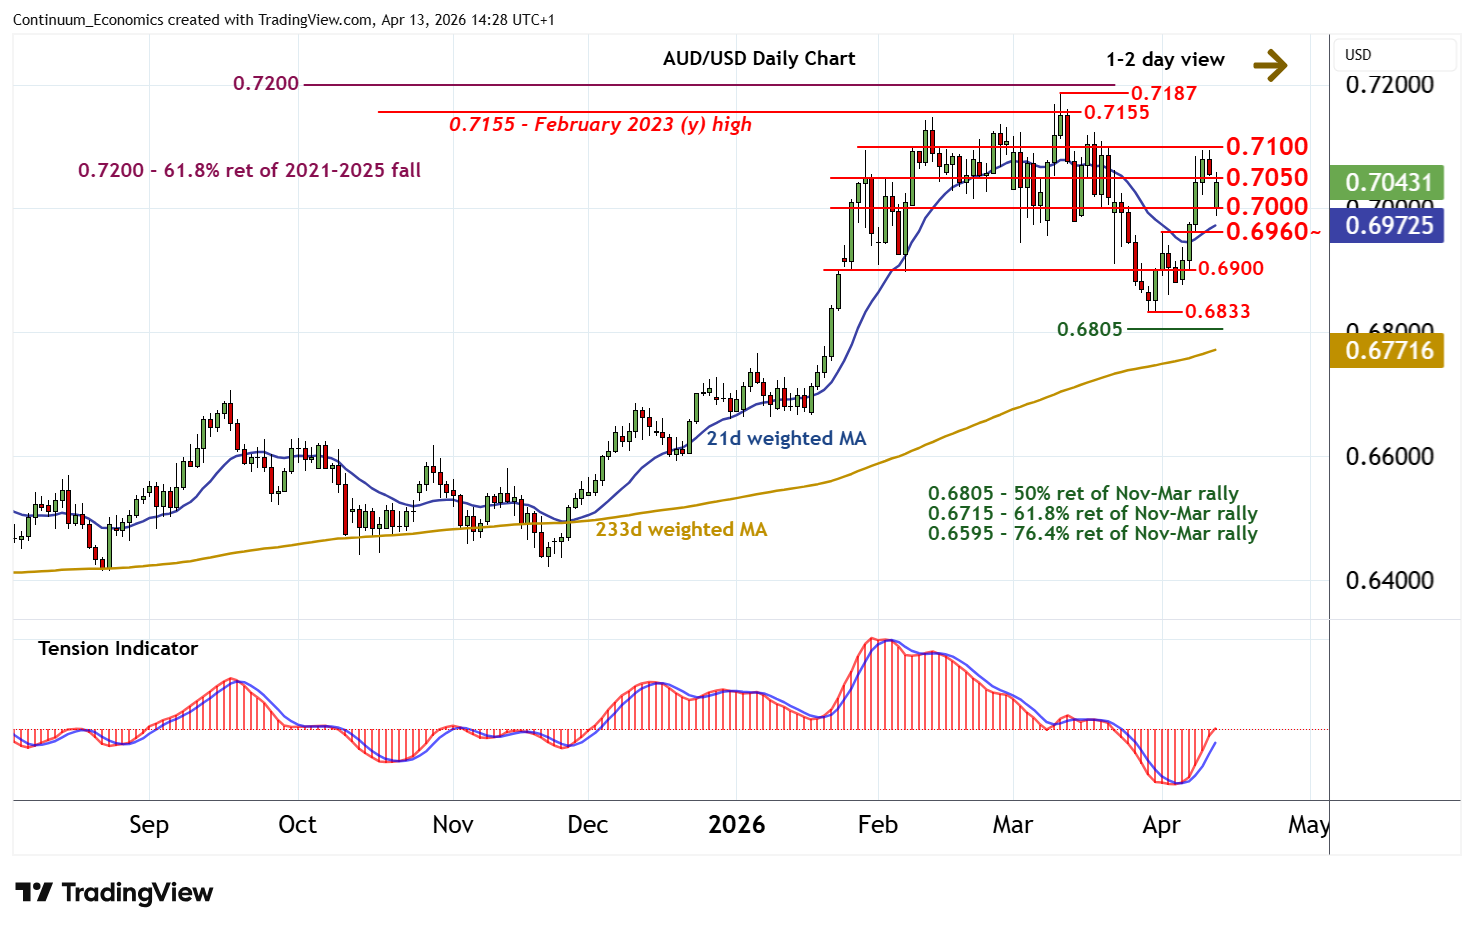
The opening gap lower has bounced from congestion support at 0.7000
| Levels | Imp | Comment | Levels | Imp | Comment | |||
|---|---|---|---|---|---|---|---|---|
| R4 | 0.7187 | ** | 11 Mar YTD high | S1 | 0.7000 | * | congestion | |
| R3 | 0.7155 | * | February 2023 (y) high | S2 | 0.6960 | * | 1 Apr (w) high | |
| R2 | 0.7100 | congestion | S3 | 0.6900 | * | break level | ||
| R1 | 0.7050 | * | congestion | S4 | 0.6833 | ** | 30 Mar (m) low |
Asterisk denotes strength of level
14:20 BST - The opening gap lower has bounced from congestion support at 0.7000, with prices currently balanced around congestion resistance at 0.7050. The rising daily Tension Indicator highlights room for a test back above here. But a tick lower in overbought daily stochastics and mixed weekly charts should limit initial scope in renewed consolidation beneath further congestion around 0.7100. Meanwhile, support is raised to 0.7000. But a close below the 0.6960 weekly high of 1 April would turn sentiment neutral and prompt fresh consolidation above support at the 0.6900 break level.