Published: 2026-02-27T02:02:53.000Z
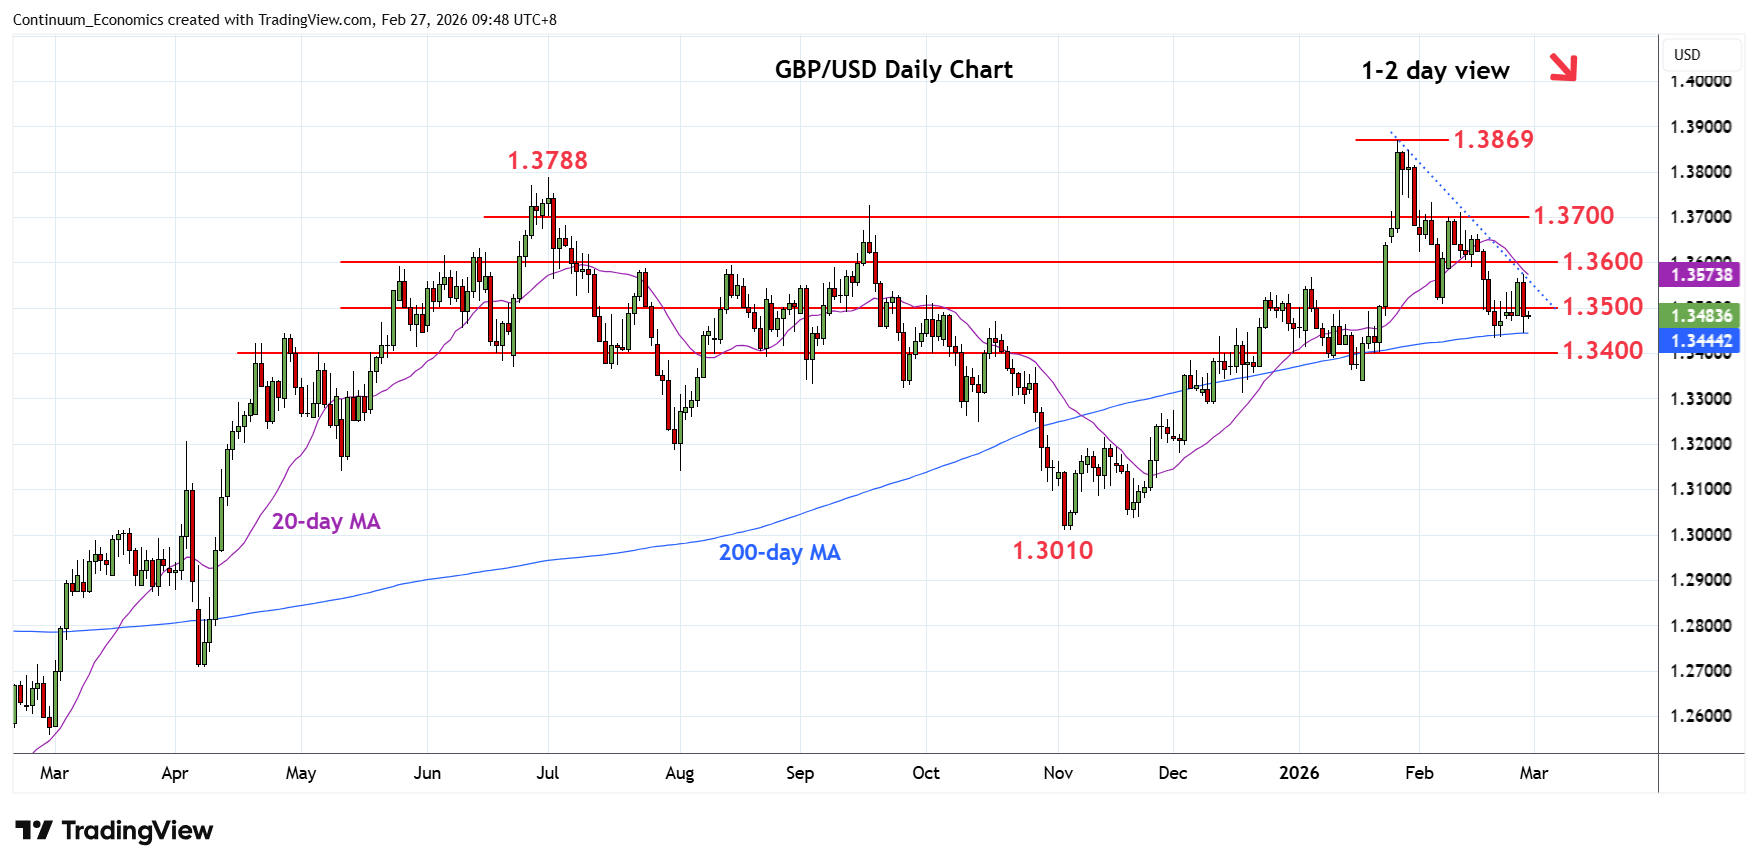
Chart GBP/USD Update: Back to retest 1.3435 low
3
Rejection from the 1.3575 high has seen break below the 1.3500 level to retest the 1.3440/35 Fibonacci level and 20 February low
| Level | Comment | Level | Comment | |||||
|---|---|---|---|---|---|---|---|---|
| R4 | 1.3700 | * | congestion | S1 | 1.3440/35 | ** | 50%, 20 Feb low | |
| R3 | 1.3650 | * | congestion | S2 | 1.3400 | * | congestion | |
| R2 | 1.3600/20 | ** | congestion | S3 | 1.3340 | ** | 19 Jan YTD low, 61.8% | |
| R1 | 1.3575 | ** | 26 Feb high | S4 | 1.3300 | * | congestion |
Asterisk denotes strength of level
01:50 GMT - Rejection from the 1.3575 high has seen break below the 1.3500 level to retest the 1.3440/35 Fibonacci level and 20 February low. The resulting outside range threatens break here to further retrace the November/January rally. Lower will see room to 1.3400 congestion then 1.3340, January current year low and 61.8% Fibonacci level. Meanwhile, resistance is lowered to the 1.3500 level which is expected to sustain pullback from the 1.3575 high. This area now expected to cap and only regaining this will fade the downside pressure.