Published: 2025-08-04T16:32:09.000Z
Chart USD/MXN Update: Consolidating gains - background studies improving

Senior Technical Strategist
1
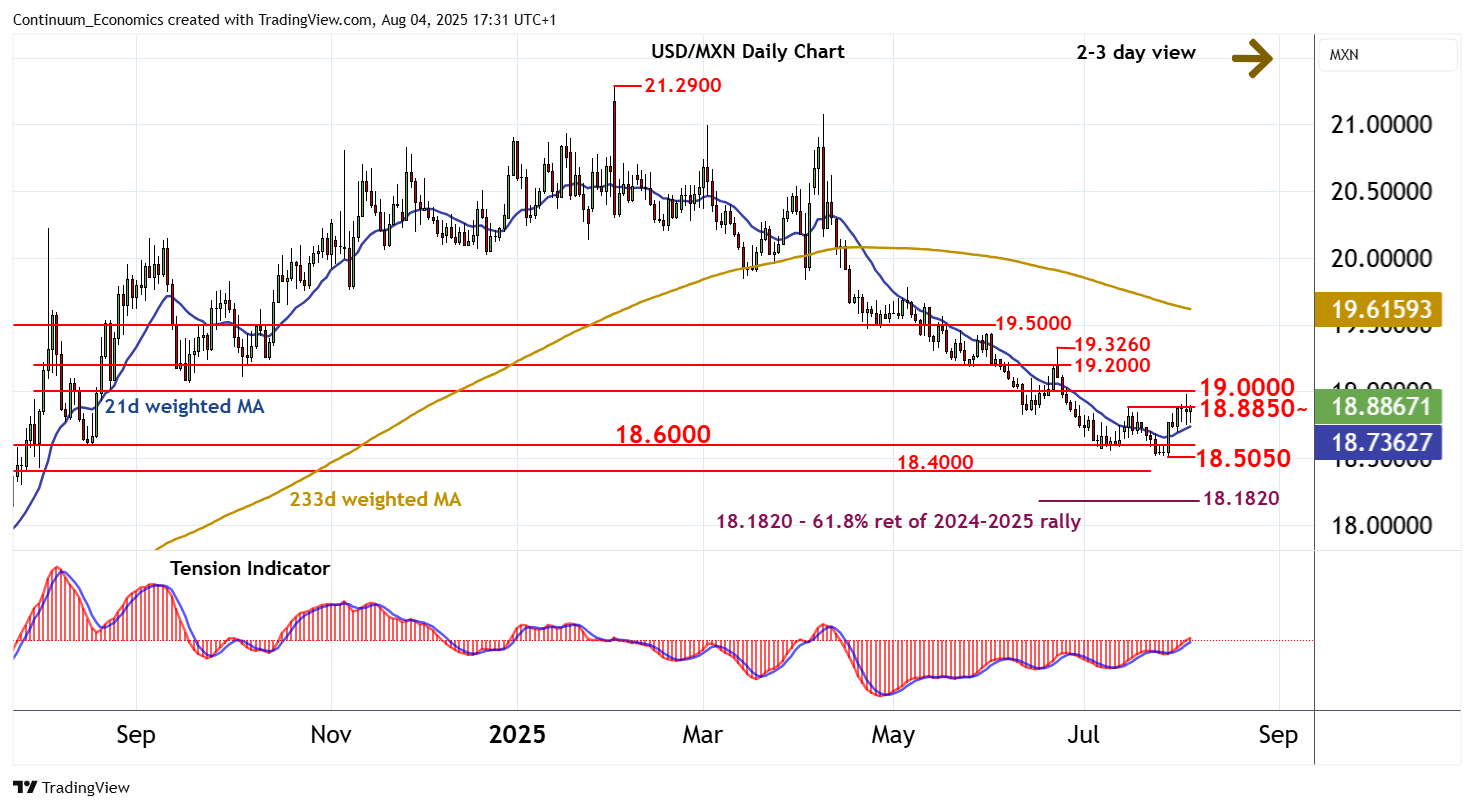
The bounce from the 18.5050 current year low of 28 July has reached the 18.8850 monthly high of 15 July
| Levels | Imp | Comment | Levels | Imp | Comment | |||
|---|---|---|---|---|---|---|---|---|
| R4 | 19.3260 | ** | 23 Jun (w) high | S1 | 18.6000 | ** | July-August 2024 break level | |
| R3 | 19.2000 | * | congestion | S2 | 18.5050 | ** | 28 Jul YTD low | |
| R2 | 19.0000 | * | congestion | S3 | 18.4265 | 1 Aug 2024 (m) low | ||
| R1 | 18.8850 | * | 15 Jul (m) high | S4 | 18.4000 | ** | congestion |
Asterisk denotes strength of level
17:10 BST - The bounce from the 18.5050 current year low of 28 July has reached the 18.8850 monthly high of 15 July, where flat overbought daily stochastics are prompting consolidation. The daily Tension Indicator is rising and broader weekly charts are showing signs of improvement, suggesting room for fresh gains in the coming sessions. A close above 18.8850 will help to improve sentiment and extend July gains beyond congestion around 19.0000 towards further congestion around 19.2000. Meanwhile, support is at 18.6000 and extends to 18.5050. This range should underpin any immediate setbacks.