Published: 2025-10-15T15:55:33.000Z
Chart USD/CAD Update: Consolidating
1
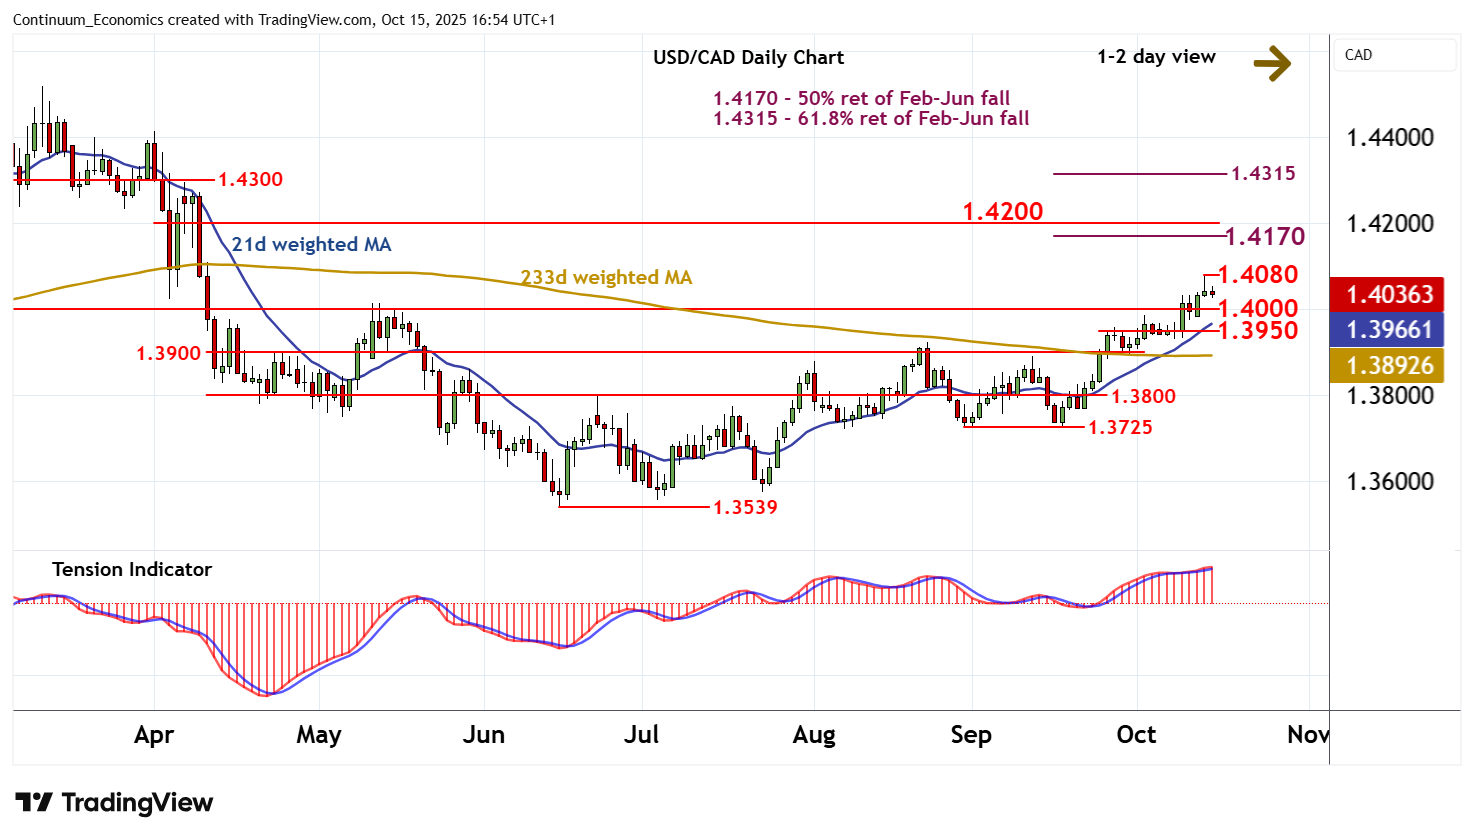
Little change, as prices extend consolidation beneath resistance at the 1.4080 high of 14 October
| Levels | Imp | Comment | Levels | Imp | Comment | |||
|---|---|---|---|---|---|---|---|---|
| R4 | 1.4300 | * | congestion | S1 | 1.4000 | * | break level | |
| R3 | 1.4200 | ** | break level | S2 | 1.3950 | * | pivot | |
| R2 | 1.4170 | ** | 50% ret of Feb-Jun fall | S3 | 1.3900 | ** | break level | |
| R1 | 1.4080 | * | 14 Oct high | S4 | 1.3800 | * | congestion |
Asterisk denotes strength of level
16:40 BST - Little change, as prices extend consolidation beneath resistance at the 1.4080 high of 14 October. The rising daily Tension Indicator is flattening, suggesting room for further consolidation, before a tick higher in daily stochastics and positive weekly charts extend June gains still further. A break above 1.4080 will turn sentiment positive and open up the 1.4170 Fibonacci retracement. But already overbought weekly stochastics could limit any initial tests in profit-taking/consolidation. Meanwhile, a close back below 1.4000 will delay higher levels and prompt consolidation above 1.3950.