Chart GBP/USD Update: Pressuring support - studies under pressure

Cautious trade has given way to anticipated selling interest
| Level | Comment | Level | Comment | |||||
|---|---|---|---|---|---|---|---|---|
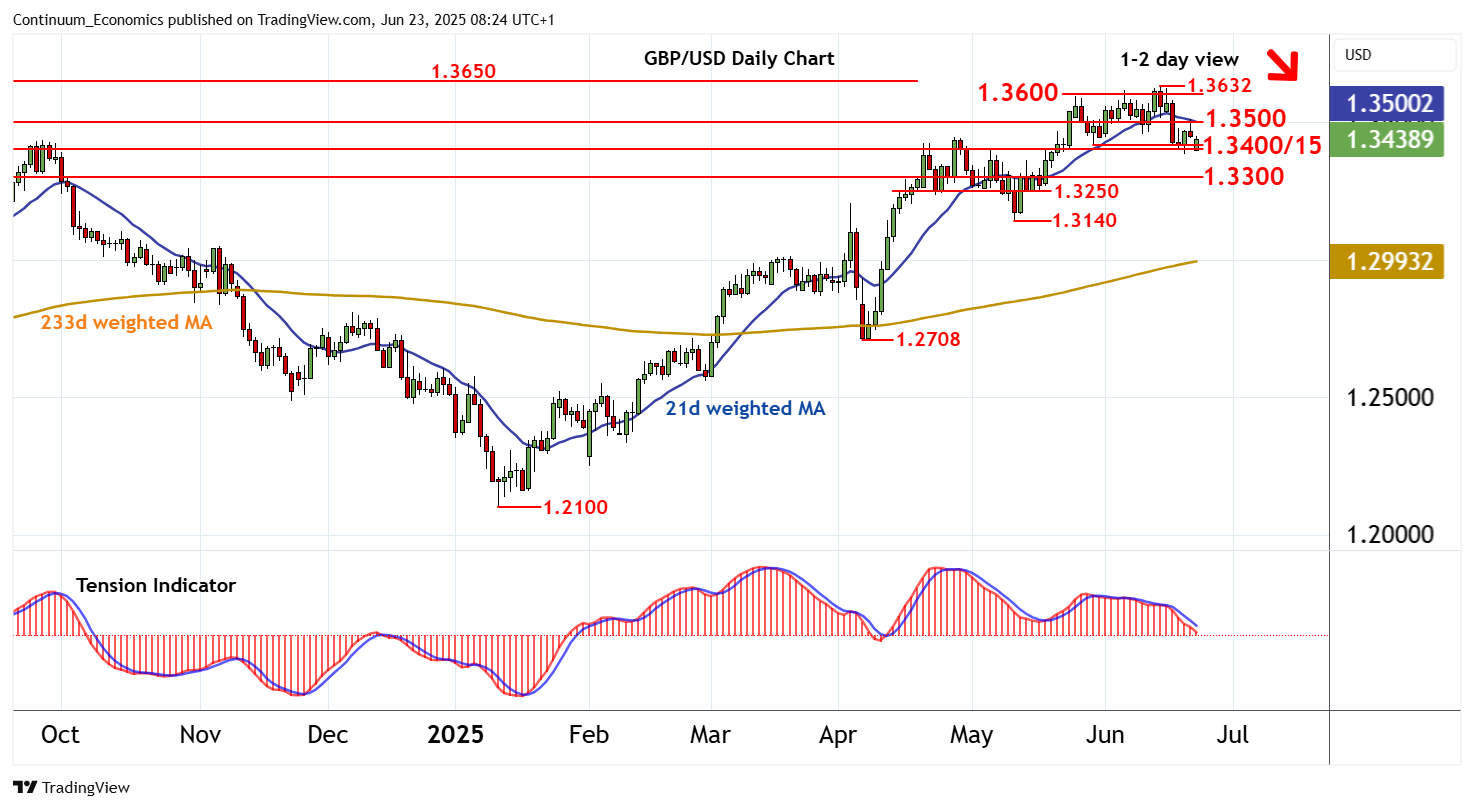
| R4 | 1.3650 | * | congestion | S1 | 1.3400/15 | * | cong; 29 May (w) low | |
| R3 | 1.3632 | ** | 12 Jun YTD high | S2 | 1.3300 | break level | ||
| R2 | 1.3600 | * | congestion | S3 | 1.3250~ | * | range lows | |
| R1 | 1.3500 | ** | congestion | S4 | 1.3140 | ** | 12 May (m) low |
Asterisk denotes strength of level
08:10 BST - Cautious trade has given way to anticipated selling interest, with prices once again testing support at congestion around 1.3400 and the 1.3415 weekly low of 29 May. Intraday studies are mixed and oversold daily stochastics are flattening, highlighting a cautious tone and room for short-term consolidation. However, the daily Tension Indicator continues to track lower and broader weekly charts are falling, pointing to a later break beneath here and extension of losses from the 1.2632 current year high of 12 June towards 1.3300. Beneath here are the 1.3250~ range lows. Meanwhile, resistance remains at congestion around 1.3500 and should cap any immediate tests higher.