Published: 2025-09-05T00:37:07.000Z
Chart NZD/USD Update: Under pressure
0
-
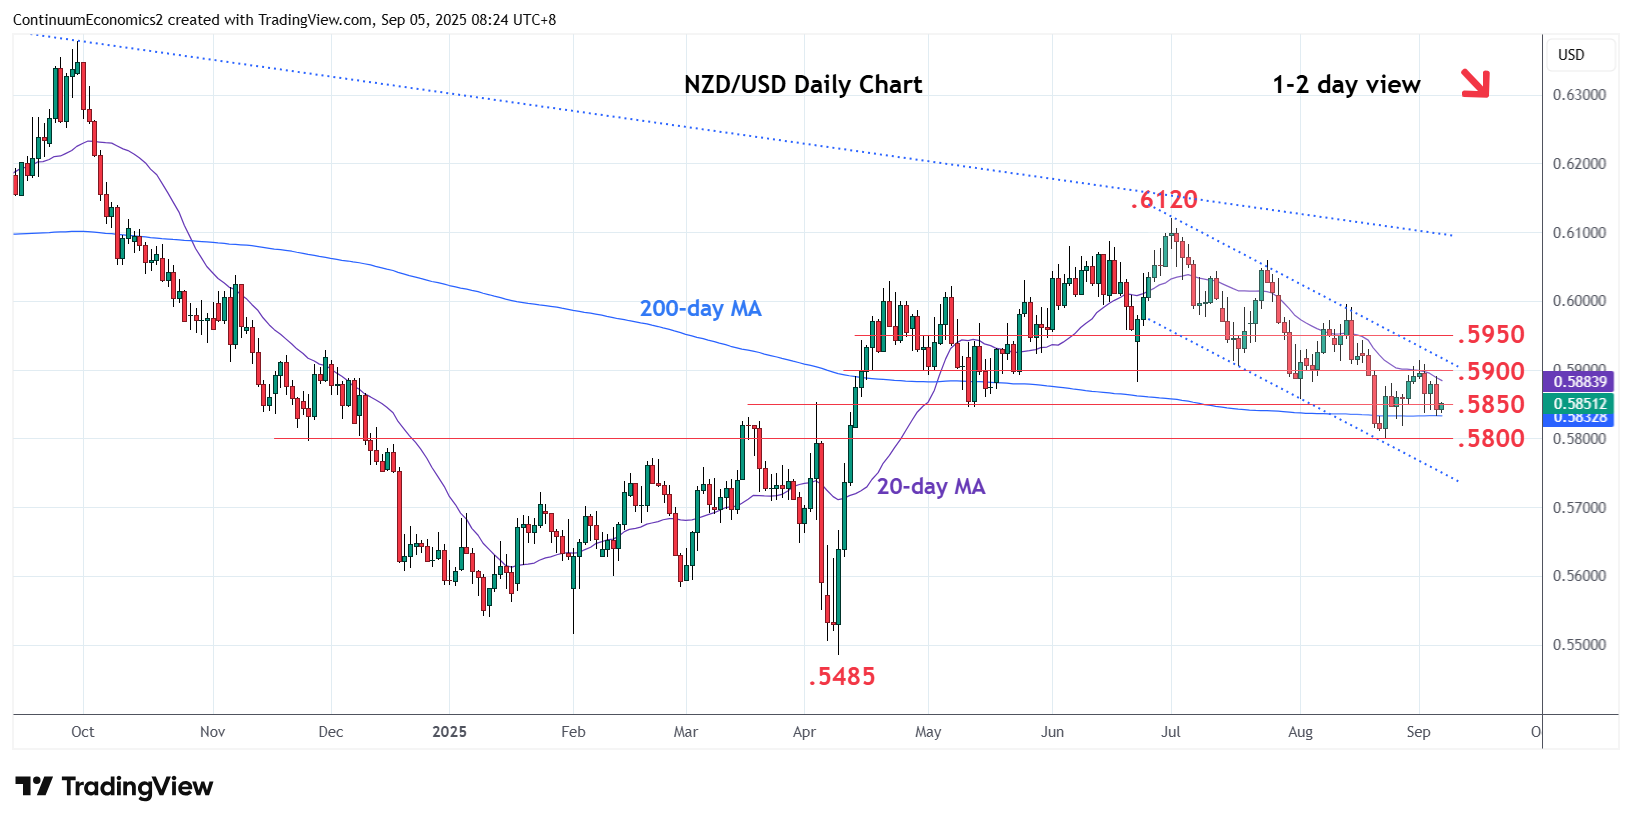
Under pressure as prices extend pullback from Monday's swing high at .5915 to reach the .5830 support
| Levels | Imp | Comment | Levels | Imp | Comment | |||
|---|---|---|---|---|---|---|---|---|
| R4 | .6050/60 | ** | congestion, 24 Jul high | S1 | .5830 | * | Mar high | |
| R3 | .5995 | ** | 13 Aug high | S2 | .5800 | ** | congestion, 50% | |
| R2 | .5950 | * | congestion | S3 | .5772 | * | Feb high | |
| R1 | .5900/15 | ** | congestion, 1 Sep high | S4 | .5730 | * | 61.8% Apr/Jul rally |
Asterisk denotes strength of level
00:30 GMT - Under pressure as prices extend pullback from Monday's swing high at .5915 to reach the .5830 support. Below here will open up the August low at .5800 to retest and see scope to further extend losses within the channel from the .6120, July current year high. Lower will see extension to .5772 support then the .5730, 61.8% Fibonacci level. Meanwhile, resistance at the .5900/15 area and channel resistance is expexted to cap. Break, if seen, will fade the downside pressure and open up room for stronger bounce to .5950/.6000 congestion.