Chart AUD/USD Update: Limited tests higher - studies under pressure
The anticipated break below the 0.6440 monthly low of 14 October has bounced from 0.6420
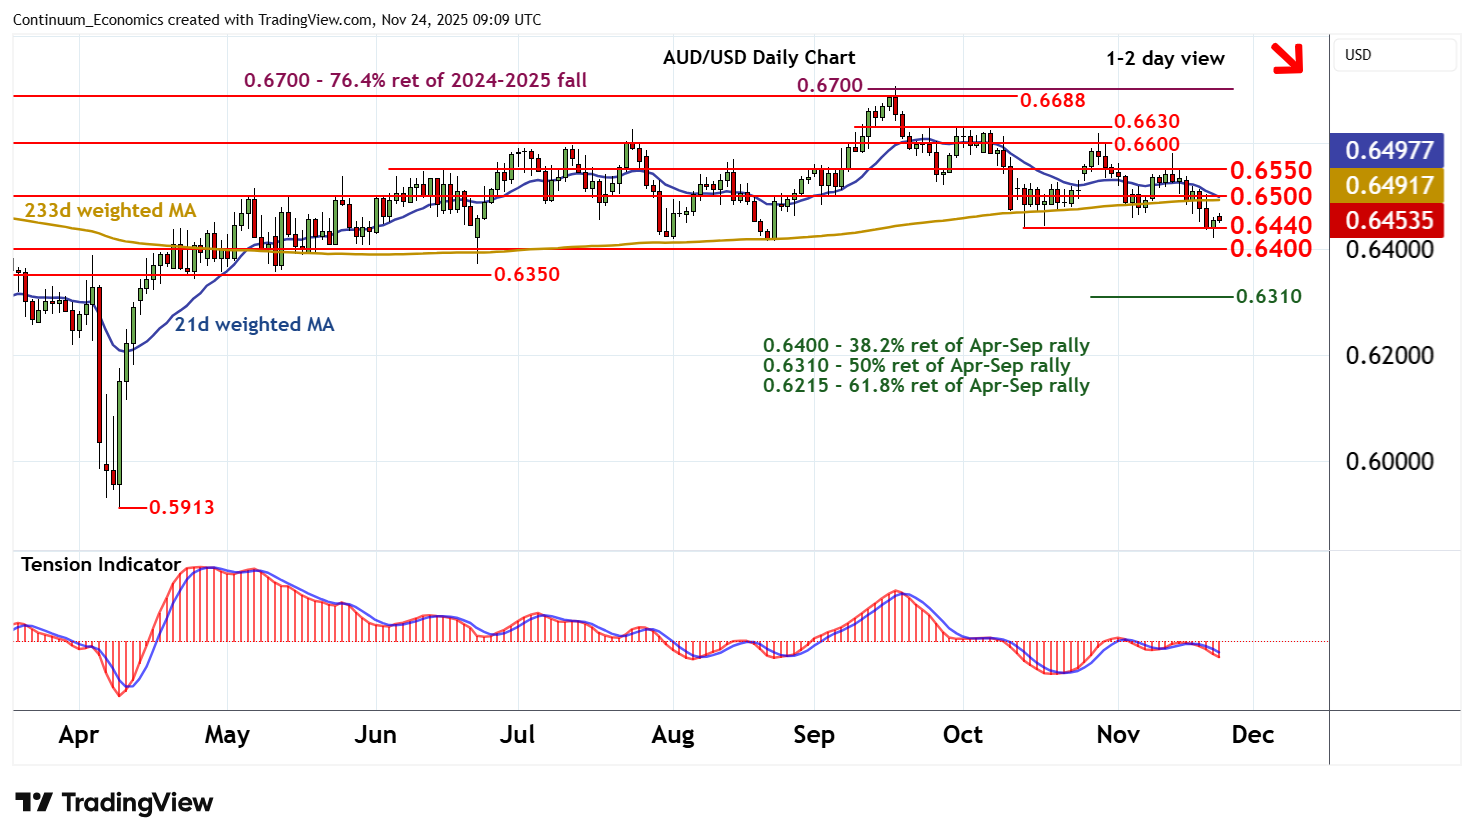
| Levels | Imp | Comment | Levels | Imp | Comment | |||
|---|---|---|---|---|---|---|---|---|
| R4 | 0.6630 | * | break level | S1 | 0.6440 | ** | 14 Oct (m) low | |
| R3 | 0.6600 | ** | congestion | S2 | 0.6400 | ** | congestion | |
| R2 | 0.6550 | * | congestion | S3 | 0.6350 | ** | congestion lows | |
| R1 | 0.6500 | * | congestion | S4 | 0.6310 | ** | 38.2% ret of Apr-Sep rally |
Asterisk denotes strength of level
09:00 GMT - The anticipated break below the 0.6440 monthly low of 14 October has bounced from 0.6420, as intraday studies turn higher and oversold daily stochastics flatten, with prices currently balanced around 0.6455. The daily Tension Indicator continues to track lower and broader weekly charts are under pressure, highlighting room for further losses in the coming sessions. A later close below 0.6440 will turn sentiment negative and extend mid-September losses initially to congestion around 0.6400. Beneath here are congestion lows around 0.6350. Meanwhile, resistance remains up to congestion around 0.6500 and should cap any immediate tests higher.