Published: 2026-05-08T12:03:20.000Z
Chart USD/RUB Update: Pressuring critical support
1
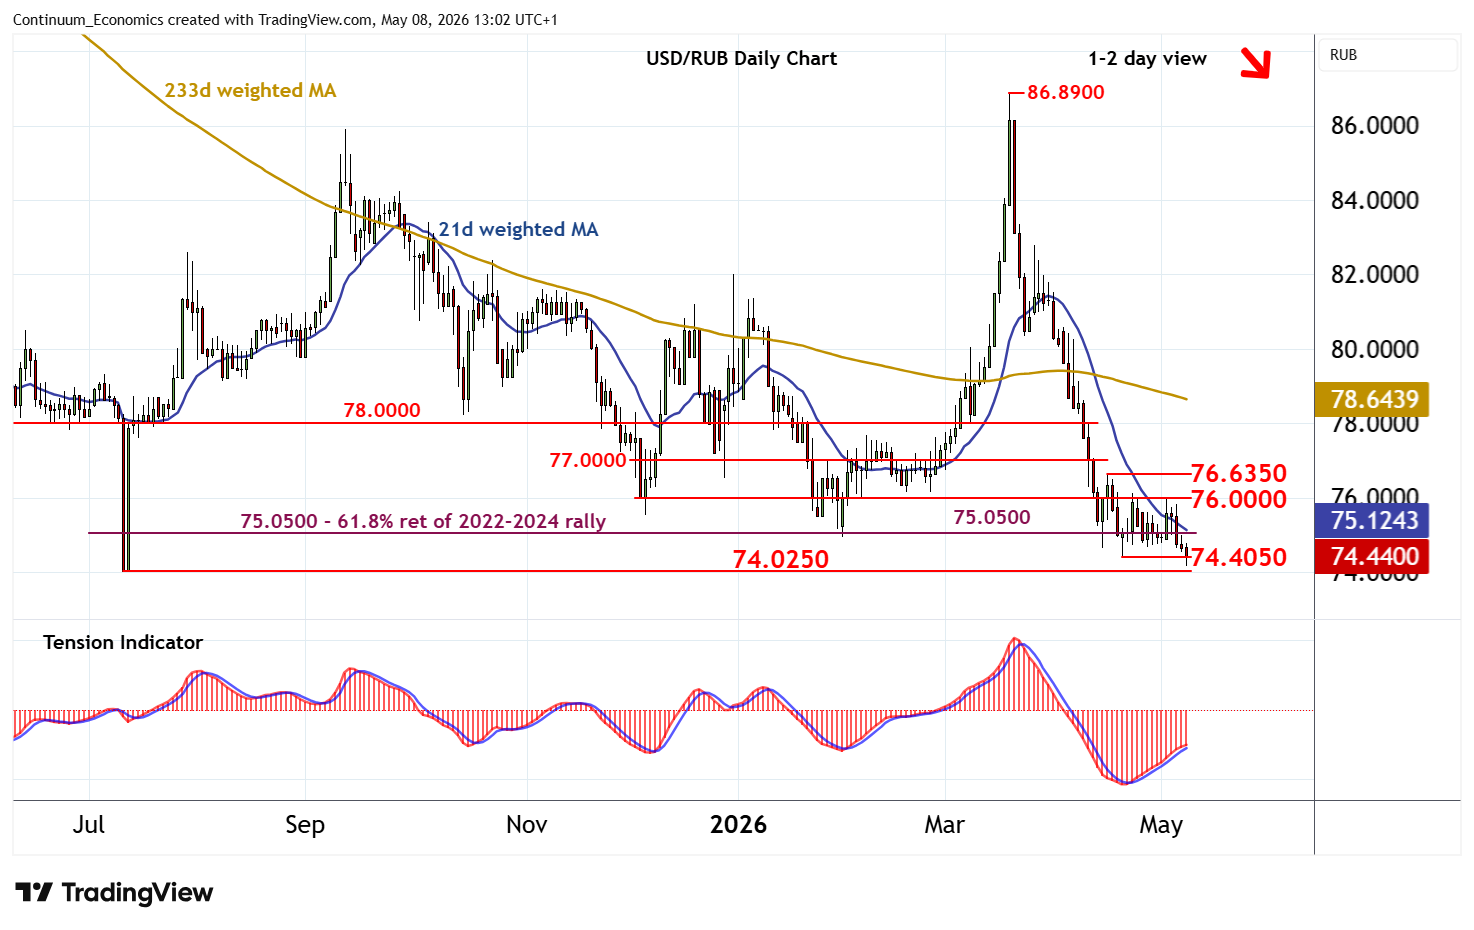
Choppy trade around the 75.0500 multi-month Fibonacci retracement is giving way to a test lower
| Levels | Comment | Levels | Comment | |||||
| R4 | 78.0000 | * | congestion | S1 | 74.4050 | * | 21 Apr (m) low | |
| R3 | 77.0000 | ** | congestion | S2 | 74.0250 | ** | 10 Jul 2025 (y) low | |
| R2 | 76.6350 | * | 16 Apr high | S3 | 72.6800 | * | late-Feb 2023 (w) low | |
| R1 | 76.0000 | * | congestion | S4 | 70.0000 | ** | congestion |
Asterisk denotes strength of level
12:30 BST - Choppy trade around the 75.0500 multi-month Fibonacci retracement is giving way to a test lower, with prices currently pressuring critical support within the 74.0250 - 74.4050 range. Daily readings are mixed/negative and broader weekly charts are bearish, highlighting room for fresh losses in the coming sessions. However, a close below the 74.0250 year low of 10 July 2025 is needed to turn sentiment negative and extend November 2024 losses into 3-year lows. Meanwhile, resistance remains up to congestion around 76.0000 and should cap any immediate tests higher.