Published: 2026-01-08T07:15:46.000Z
Chart GBP/JPY Update: Extending pullback from 212.15 high
3
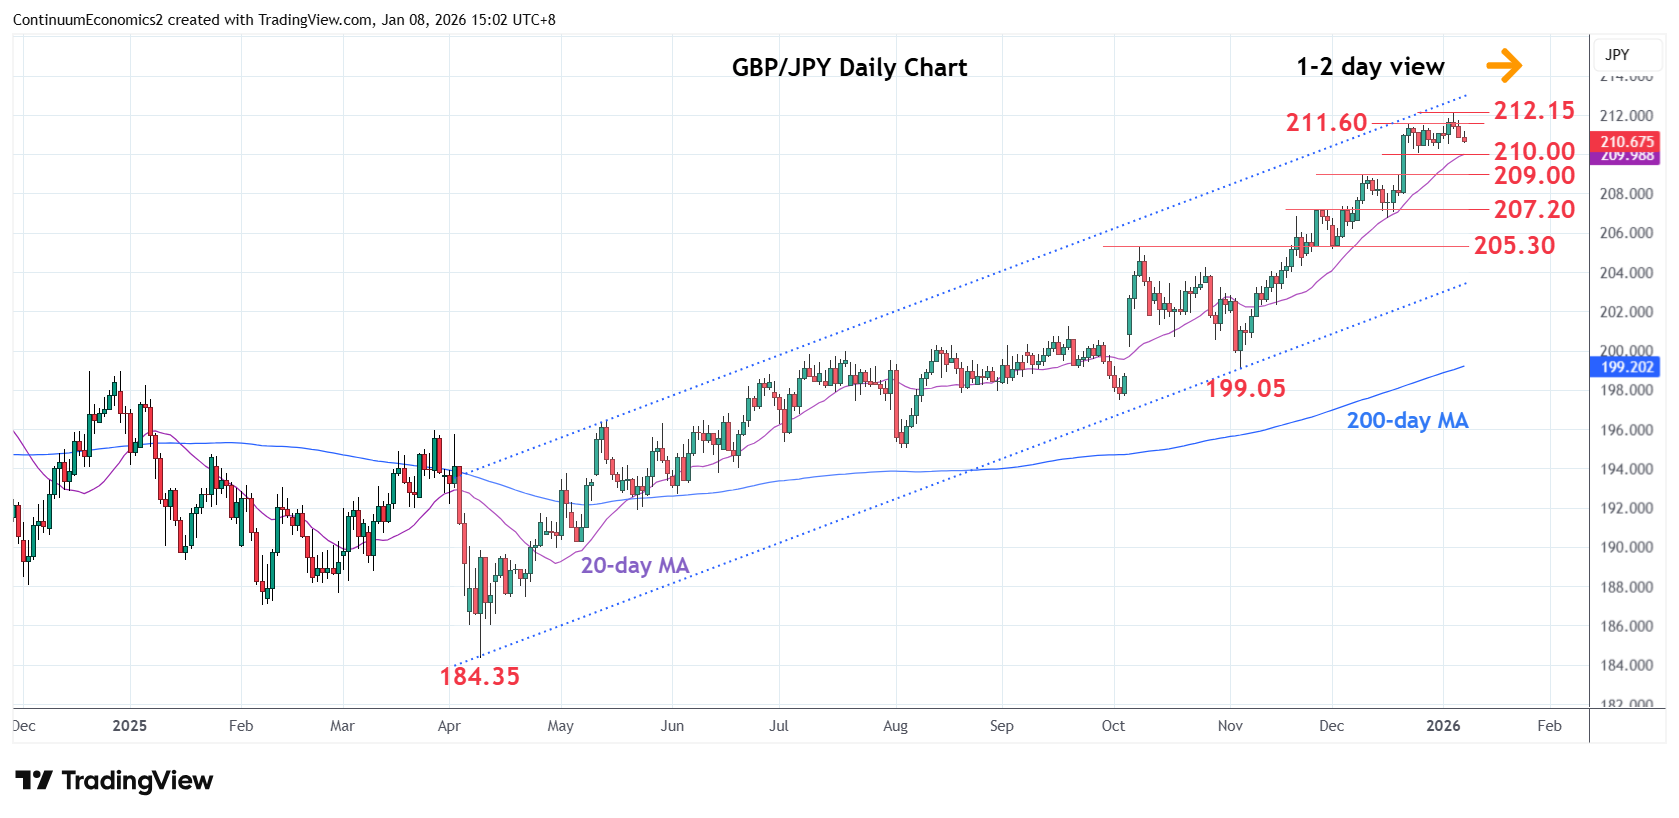
Break above the December 2025 year high at 211.60 has seen gains stalling at 212.15 high
| Levels | Imp | Comment | Levels | Imp | Comment | |||
|---|---|---|---|---|---|---|---|---|
| R4 | 217.30 | * | 8 Jan 2008 high | S1 | 210.00 | * | congestion | |
| R3 | 216.00 | ** | Jul 2008 high | S2 | 209.00 | ** | 9 Dec high | |
| R2 | 214.00/10 | * | congestion, Aug 2008 high | S3 | 208.00 | * | congestion | |
| R1 | 212.15 | * | 6 Jan high | S4 | 207.20 | ** | Nov high |
Asterisk denotes strength of level
06:50 GMT - Break above the December 2025 year high at 211.60 has seen gains stalling at 212.15 high. Rejection there see prices unwinding overbought daily studies and see room to support at the 210.00 congestion. Would take break here to open up room for deeper pullback to retrace strong gains from the 199.05 November low to support at the 209.00/208.00 area. Meanwhile, resistance at the 211.60 and 212.15 highs area expected to cap. Clearance, if seen, will further extend the underlying bull trend from the September 2011 year low to the August 2008 high at 214.10.