Published: 2026-02-27T12:37:12.000Z
Chart USD/ZAR Update: Further consolidation - background studies under pressure
-
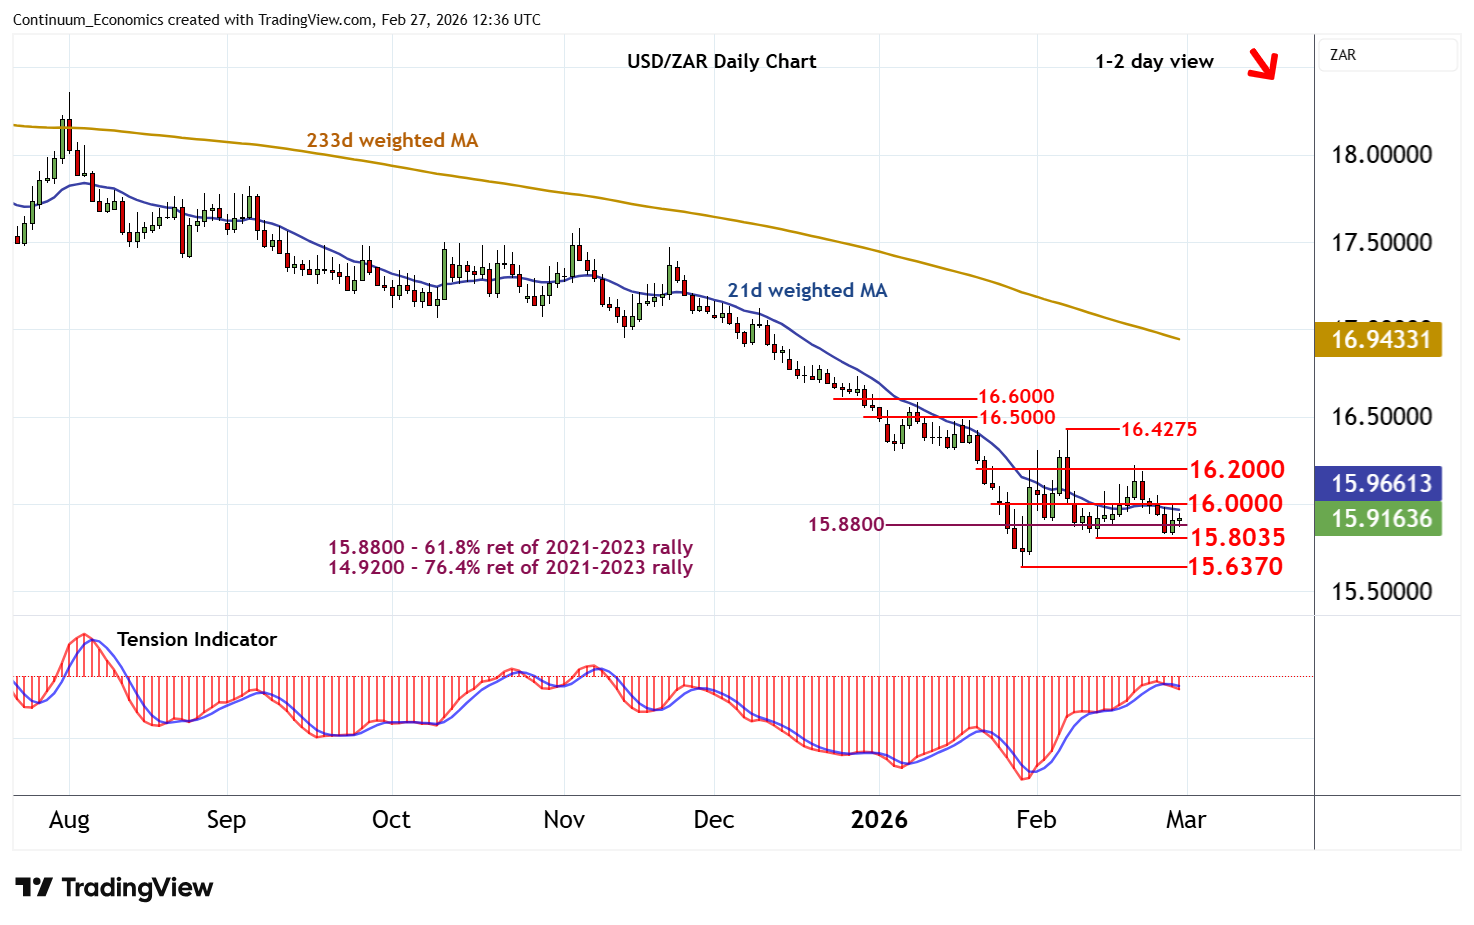
Little change, as prices extend cautious trade within the 15.8035 - 16.0000 range
| Level | Comment | Level | Comment | |||||
|---|---|---|---|---|---|---|---|---|
| R4 | 16.5000 | break level | S1 | 15.8035 | * | 12 Feb (w) low | ||
| R3 | 16.4275 | * | 6 Feb (w) high | S2 | 15.6370 | ** | 29 Jan YTD low | |
| R2 | 16.2000 | minor congestion | S3 | 15.1665 | * | June 2022 low | ||
| R1 | 16.0000 | ** | congestion | S4 | 15.0000 | ** | congestion |
Asterisk denotes strength of level
12:20 GMT - Little change, as prices extend cautious trade within the 15.8035 - 16.0000 range following the test of congestion resistance at 16.0000. Daily readings remain bearish and broader weekly charts are mixed/negative, highlighting room for fresh losses in the coming sessions. Support is at the 15.8035 weekly low of 12 February. But a further close below critical support at the 15.6370 current year low of 29 January is needed to turn sentiment negative and confirm continuation of April 2025 losses. Meanwhile, any tests above 16.0000 should fade into consolidation beneath further congestion around 16.2000.