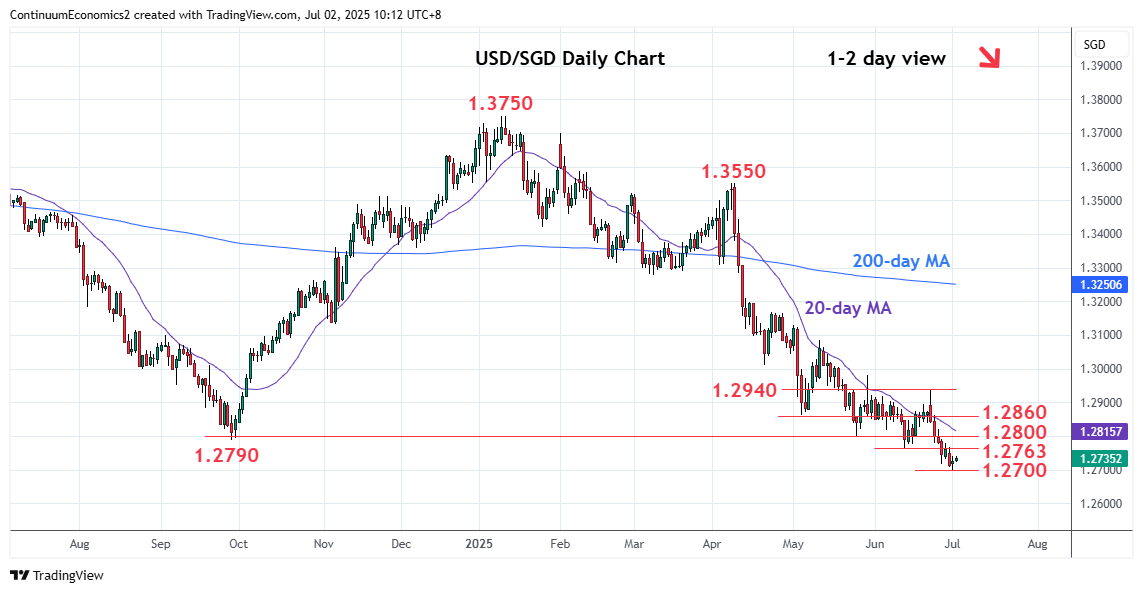
Chart USD/SGD Update: Shallow bounce from 1.2700 low

Turned up from the 1.2700 low as prices unwind oversold intraday studies and consolidate losses from the high of last week
| Level | Comment | Level | Comment | ||||
|---|---|---|---|---|---|---|---|
| R4 | 1.2940 | ** | 23 Jun high | S1 | 1.2700 | ** | 1 Jul YTD low |
| R3 | 1.2860 | * | 5 May low | S2 | 1.2676 | * | Oct 2014 low |
| R2 | 1.2800 | * | 26 May low | S3 | 1.2600 | * | congestion |
| R1 | 1.2763 | * | 12 Jun low | S4 | 1.2550 | * | congestion, Aug 2014 high |
Asterisk denotes strength of level
02:20 GMT - Turned up from the 1.2700 low as prices unwind oversold intraday studies and consolidate losses from the high of last week. However, bearish momentum keeps focus on the downside and break will further extend losses from the multi-year top pattern at 1.4646, 2020 year high. Lower will see room for extension to support at 1.2676, low of October 2014. Meanwhile, resistance is at the 1.2763/1.2800 previous lows and congestion area which is expected to cap. Would take break here to ease the downside pressure and see room for stronger corrective bounce to the 1.2860/1.2900 congestion.