Chart USD/RUB Update: Leaning lower
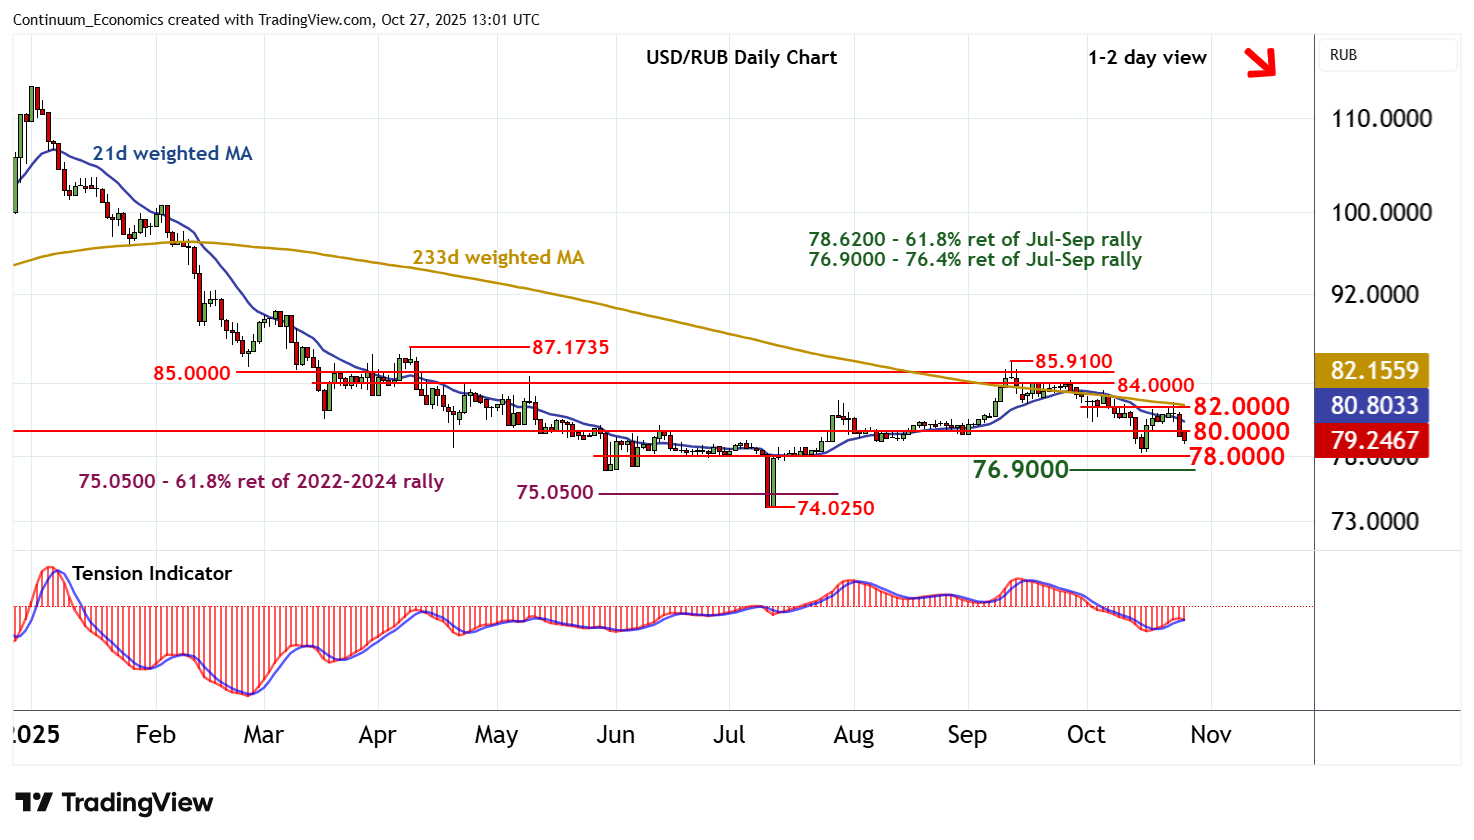
The test of congestion resistance at 82.0000 has not been sustained
| Levels | Comment | Levels | Comment | |||||
| R4 | 85.0000 | ** | congestion | S1 | 78.2270 | * | 15 Oct (w) low | |
| R3 | 84.0000 | * | congestion | S2 | 78.0000 | ** | congestion | |
| R2 | 82.0000 | ** | congestion | S3 | 76.9000 | ** | 76.4% ret of Jul-Sep rally | |
| R1 | 80.0000 | ** | congestion | S4 | 75.0500 | ** | 61.8% ret of 2022-2024 rally |
Asterisk denotes strength of level
12:45 GMT - The test of congestion resistance at 82.0000 has not been sustained, as overbought daily stochastics unwind, with steady selling interest posting a break below 80.0000 to currently trade around 79.2500. The daily Tension Indicator has also turned down and broader weekly charts are under pressure, highlighting room for continuation down to the 78.2270 weekly low of 15 October and congestion around 78.0000. A close beneath here would add weight to sentiment and extend September losses towards the 76.9000 Fibonacci retracement, where short-covering/consolidation is expected to appear. Meanwhile, a close back above congestion resistance at 80.0000 would help to stabilise price action and prompt consolidation beneath 82.0000.