Published: 2025-09-08T07:28:20.000Z
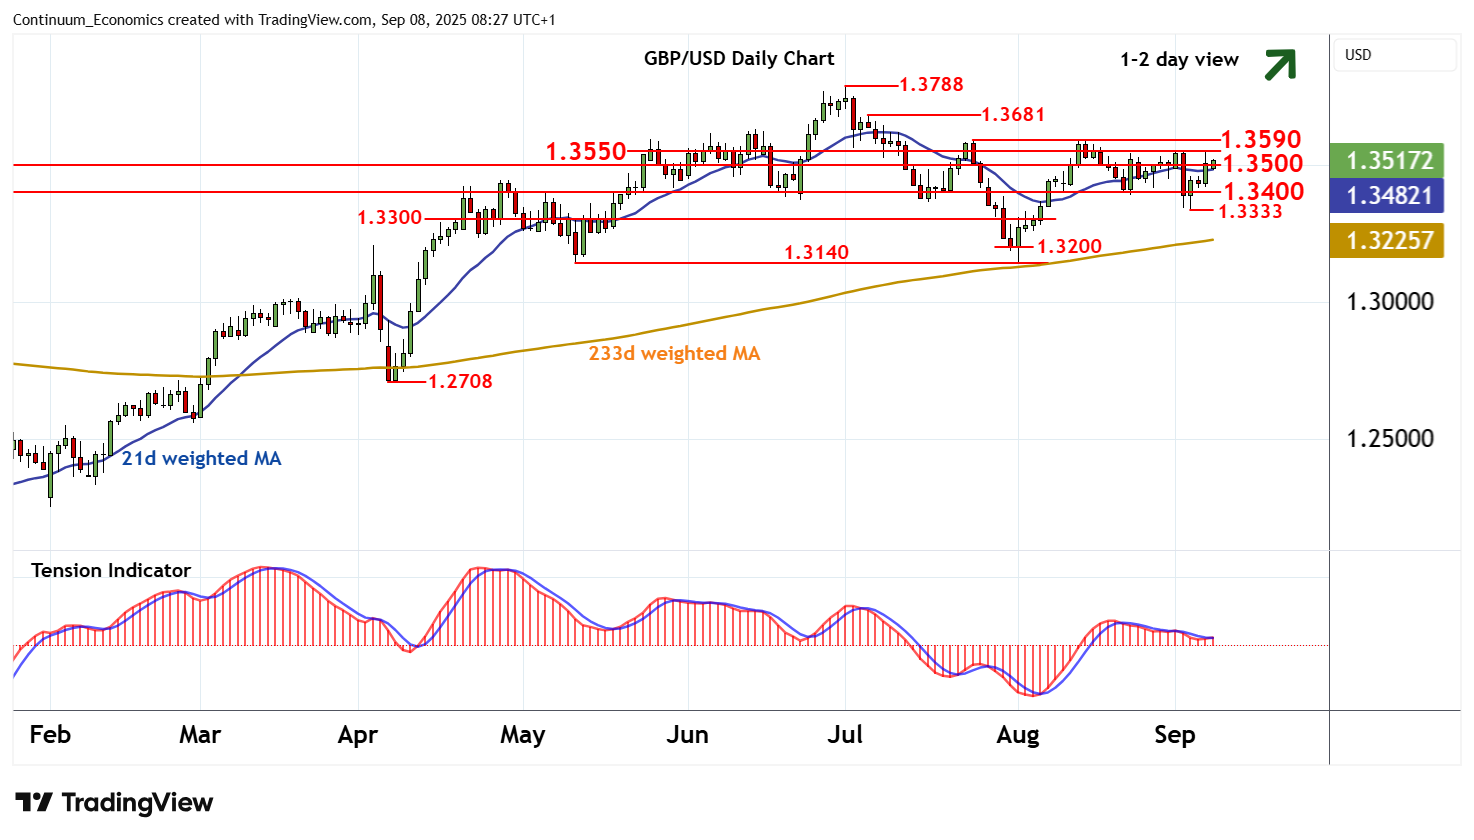
Chart GBP/USD Update: Edging higher
0
-
The break above 1.3500 has been pushed back from resistance at 1.3550

| Level | Comment | Level | Comment | |||||
|---|---|---|---|---|---|---|---|---|
| R4 | 1.3788 | ** | 1 Jul YTD high | S1 | 1.3500 | ** | congestion | |
| R3 | 1.3681 | 4 Jul high | S2 | 1.3400 | * | congestion | ||
| R2 | 1.3590/00 | ** | 24 Jul (w) high; cong | S3 | 1.3333 | * | 3 Sep low | |
| R1 | 1.3550 | intraday break level | S4 | 1.3300 | * | congestion |
Asterisk denotes strength of level
08:10 BST - The break above 1.3500 has been pushed back from resistance at 1.3550, as intraday studies turn mixed, with prices currently balanced around 1.3515. Daily readings are mixed/positive, highlighting potential for a retest of 1.3550. But mixed weekly charts are expected to limit any initial break in fresh selling interest towards the 1.3590 weekly high of 24 July and congestion around 1.3600. Meanwhile, any immediate tests below congestion support at 1.3500 should be limited in consolidation above further congestion around 1.3400.