Published: 11/03/25 at 11:37 UTC
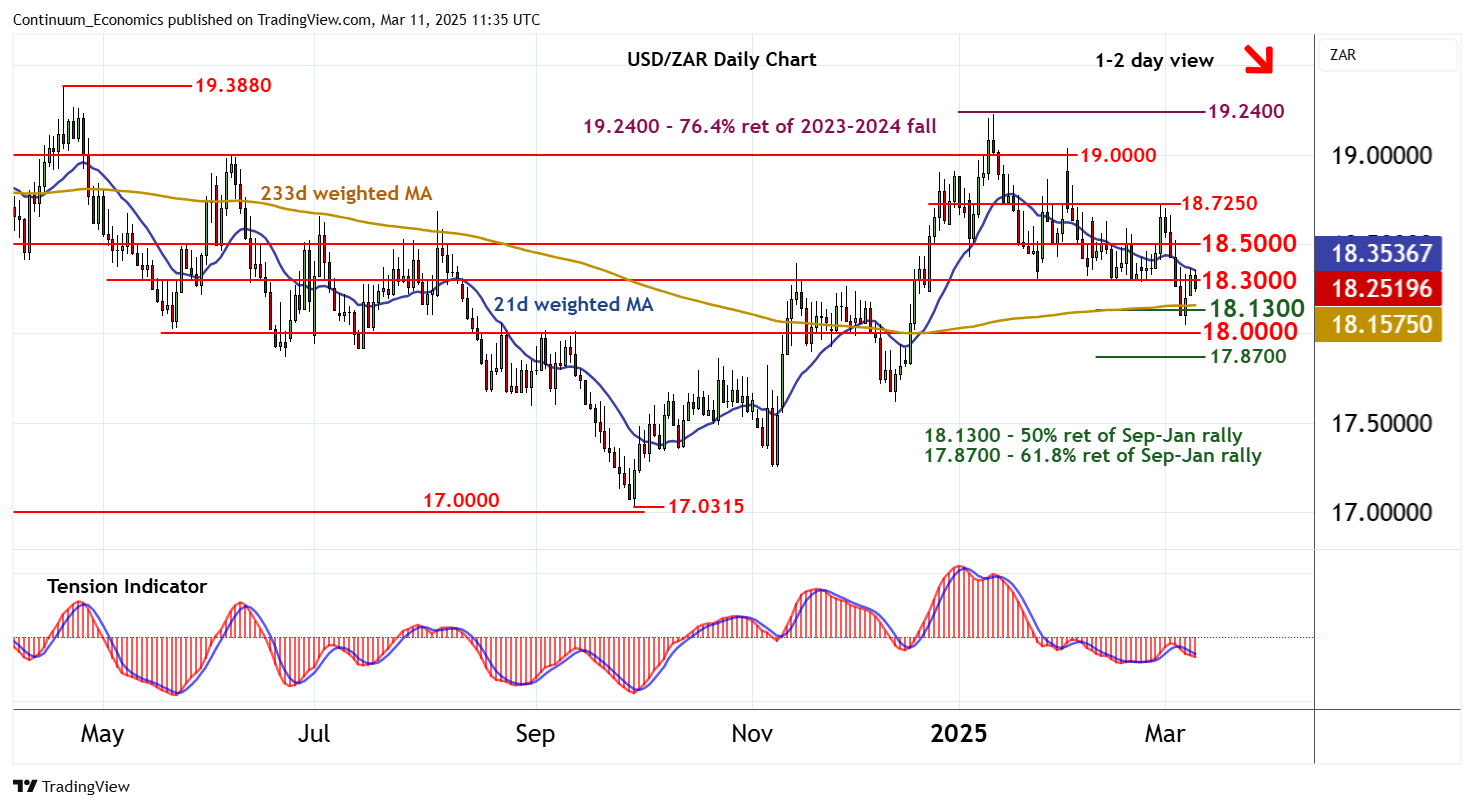
Chart USD/ZAR Update: Limited corrective gains

Senior Technical Strategist
-
The test above 18.3000 has not been sustained
| Level | Comment | Level | Comment | |||||
|---|---|---|---|---|---|---|---|---|
| R4 | 18.8500 | break level | S1 | 18.1300 | * | 50% ret of Sep-Jan rally | ||
| R3 | 18.7250 | * | congestion | S2 | 18.0000 | ** | congestion | |
| R2 | 18.5000 | ** | break level | S3 | 17.8700 | ** | 61.8% ret of Sep-Jan rally | |
| R1 | 18.3000 | ** | break level | S4 | 17.7500 | * | break level |
Asterisk denotes strength of level
11:20 GMT - The test above 18.3000 has not been sustained, as overbought intraday studies unwind, with prices currently trading back beneath here. Focus is expected to turn to support at the 18.1300 Fibonacci retracement. But rising daily readings should limit any initial break in renewed consolidation above congestion support at 18.0000. Negative weekly charts, however, point to a later break beneath here and extension of January losses towards the 17.8700 retracement. Meanwhile, a close above 18.300 would turn sentiment neutral and prompt consolidation beneath 18.5000.