Published: 2026-03-17T01:05:53.000Z
Chart USD/JPY Update: Lower in consolidation from 159.75 current year high
2
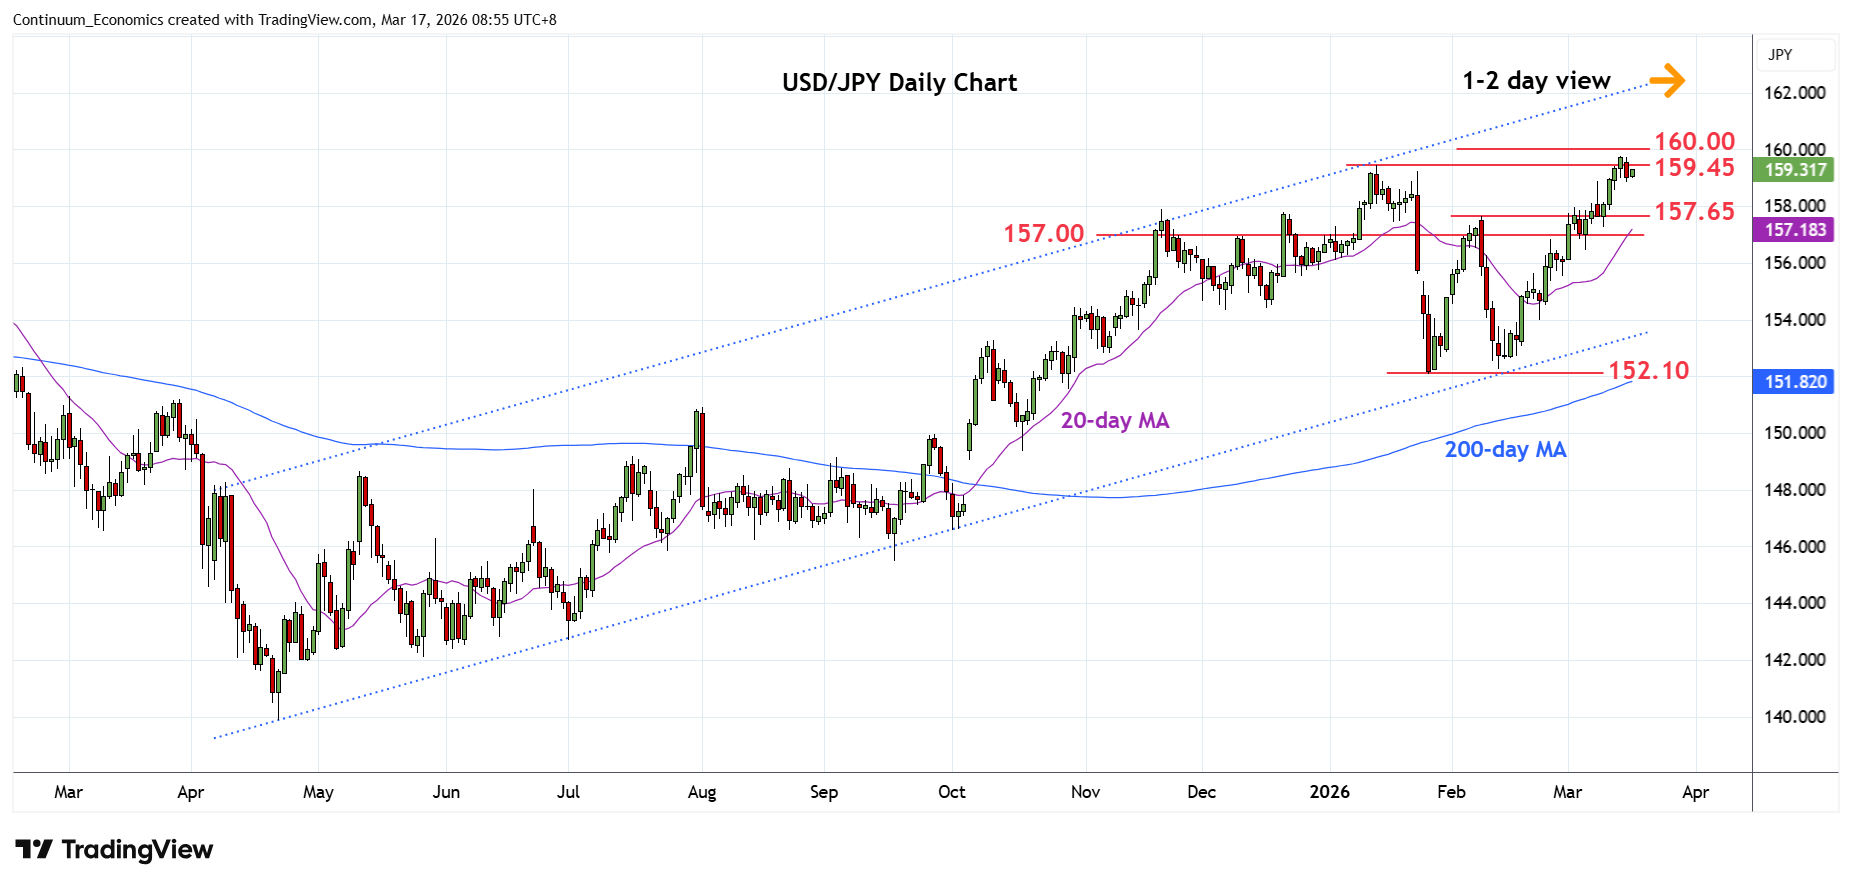
Lower in consolidation from the 159.75 current year high as prices unwind overbought intraday stuides
| Levels | Imp | Comment | Levels | Imp | Comment | |||
|---|---|---|---|---|---|---|---|---|
| R4 | 161.95 | ** | Jul 2024 year high | S1 | 158.50 | congestion | ||
| R3 | 161.00 | * | congestion | S2 | 158.00 | * | congestion | |
| R2 | 160.00 | ** | figure | S3 | 157.65 | ** | 9 Feb high | |
| R1 | 159.75 | ** | 13 Mar YTD high | S4 | 157.00 | * | congestion |
Asterisk denotes strength of level
01:00 GMT - Lower in consolidation from the 159.75 current year high as prices unwind overbought intraday studies. Daily chart are stretched as well and break of the nearby support at 159.00/158.90 will open up room deeper corrective pullback to the 158.50/158.00 congestion area. Below this see strong support at the 157.65 expected to underpin and limit corrective pullback. Meanwhile, resistance at the 159.45 and 159.75 highs expected to cap for now. A later break here will further extend gains within the bull channel from the April low and see room to retest the 160.00 figure.