Published: 2025-03-13T11:35:06.000Z
Chart USD/ZAR Update: Limited tests higher

Senior Technical Strategist
-
Little change, as prices extend cautious trade above support at 18.3000
| Level | Comment | Level | Comment | |||||
|---|---|---|---|---|---|---|---|---|
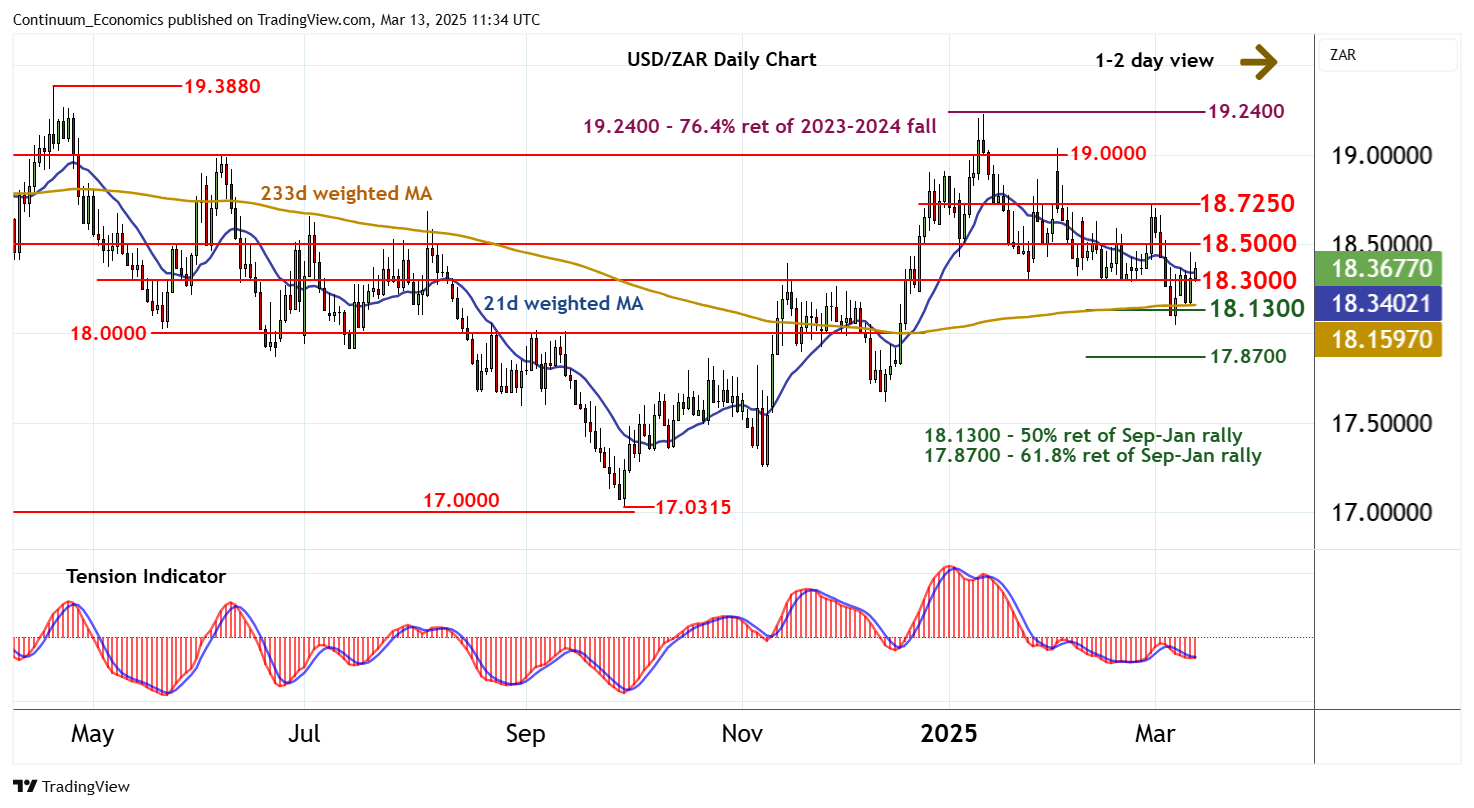
| R4 | 19.0000 | * | break level | S1 | 18.3000 | ** | break level | |
| R3 | 18.8500 | break level | S2 | 18.1300 | * | 50% ret of Sep-Jan rally | ||
| R2 | 18.7250 | * | congestion | S3 | 18.0000 | ** | congestion | |
| R1 | 18.5000 | ** | break level | S4 | 17.8700 | ** | 61.8% ret of Sep-Jan rally |
Asterisk denotes strength of level
11:30 GMT - Little change, as prices extend cautious trade above support at 18.3000. Oversold daily stochastics are unwinding and the bearish daily Tension Indicator is flattening, suggesting potential for a test of resistance at 18.5000. However, negative weekly charts are expected to limit any extension beyond here in renewed selling interest towards congestion around 18.7250. Meanwhile, support remains down to the 18.1300 Fibonacci retracement. A break beneath here, not yet seen, will add weight to sentiment and extend January losses below congestion around 18.0000 towards the 17.8700 retracement.