Published: 2026-05-05T07:58:02.000Z
Chart USD Index DXY Update: Limited tests higher
1
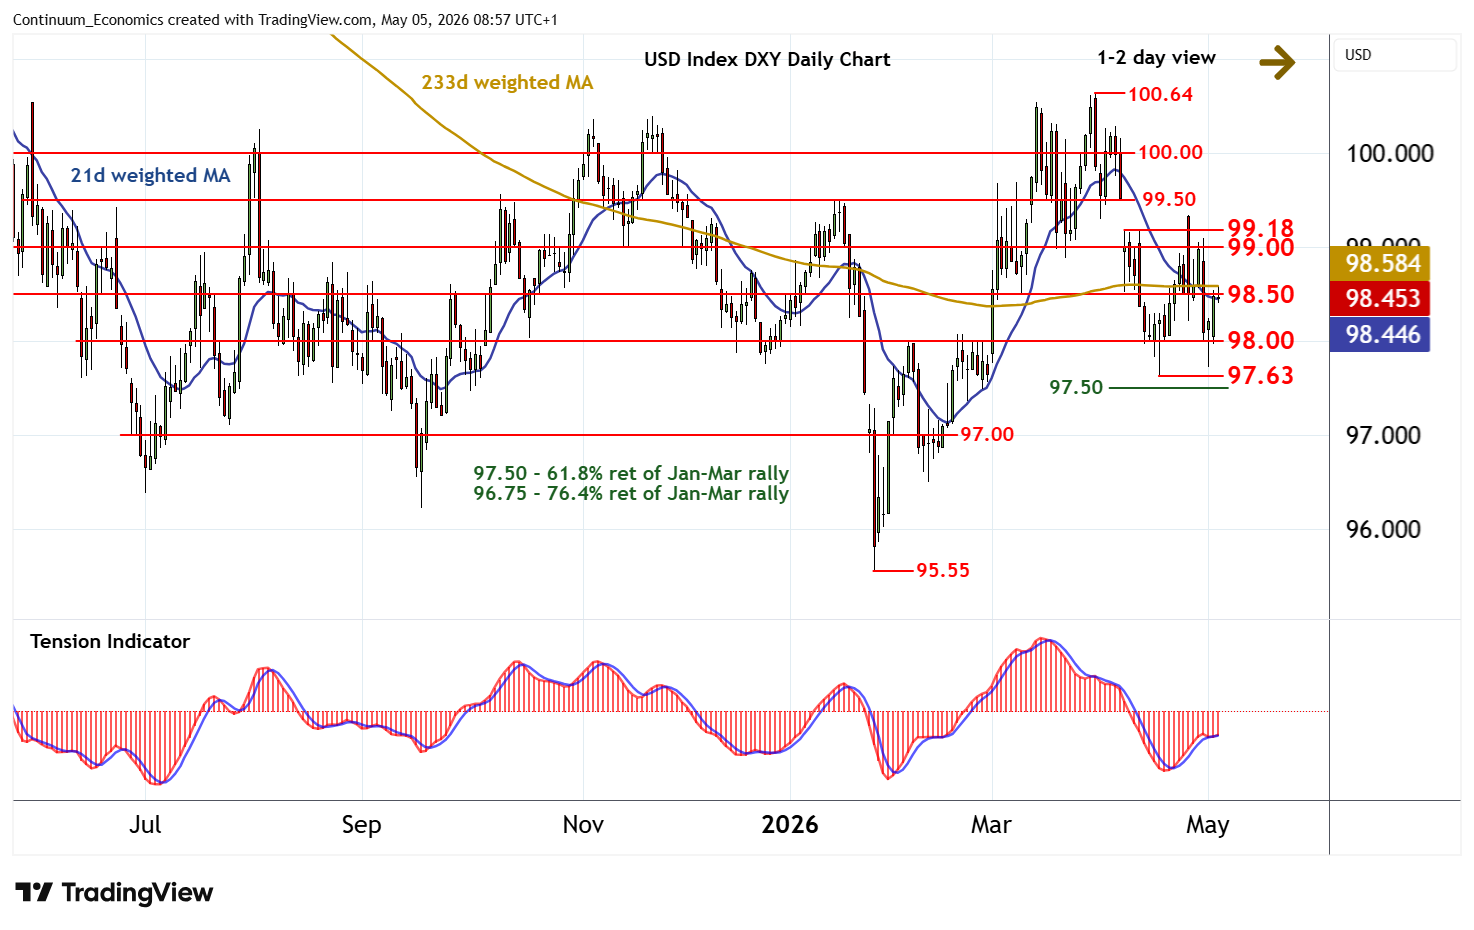
Anticipated losses have bounced from above support at the 97.63 monthly low of 17 April
| Levels | Imp | Comment | Levels | Imp | Comment | |||
|---|---|---|---|---|---|---|---|---|
| R4 | 100.00 | ** | congestion | S1 | 98.00 | ** | congestion | |
| R3 | 99.50 | * | congestion | S2 | 97.63 | * | 17 Apr (m) low | |
| R2 | 99.00/18 | ** | congestion; 8 Apr high | S3 | 97.50 | ** | congestion; 61.8% ret | |
| R1 | 98.50 | * | congestion | S4 | 97.00 | ** | congestion |
Asterisk denotes strength of level
08:45 BST - Anticipated losses have bounced from above support at the 97.63 monthly low of 17 April, with prices currently trading around congestion resistance at 98.50. Daily readings are mixed/positive, highlighting room for a test above here. But mixed weekly charts should limit initial scope in renewed consolidation beneath strong resistance at congestion around 99.00 and the 99.18 high of 8 April. Meanwhile, support is at congestion around 98.00. But a close below 97.63 would turn sentiment negative and confirm continuation of late-March losses below 97.50.