Published: 2026-01-23T07:17:45.000Z
Chart EUR/AUD Update: Extending losses
-
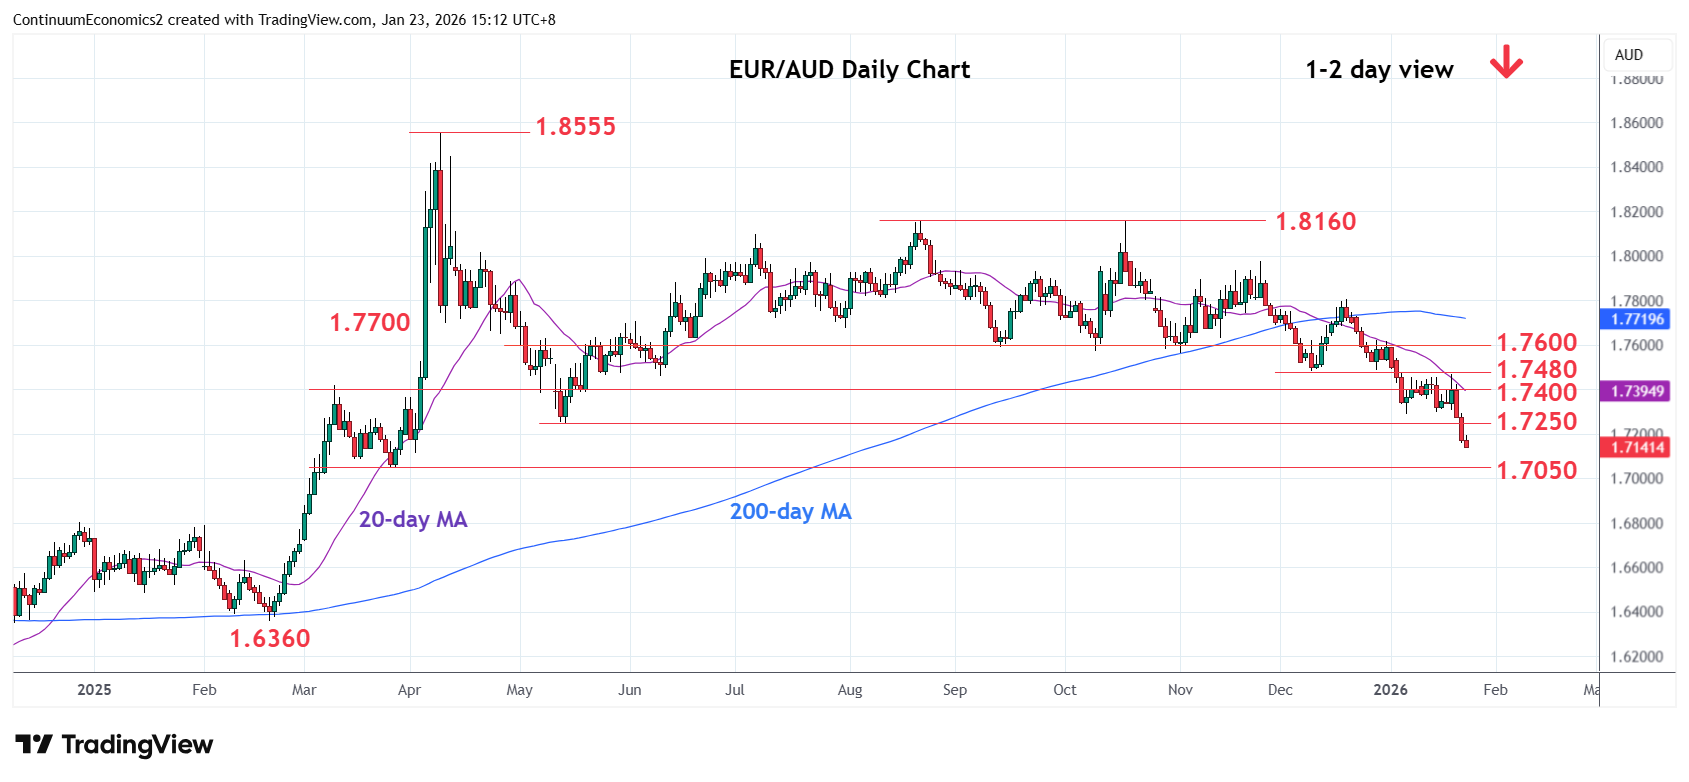
Follow-through below support at the 1.7250 May low and 1.7200 level see prices extending the broader losses from the April 2025 year high.
| Levels | Imp | Comment | Levels | Imp | Comment | |||
|---|---|---|---|---|---|---|---|---|
| R4 | 1.7600 | ** | congestion | S1 | 1.7110 | * | Apr low | |
| R3 | 1.7480 | * | Dec low | S2 | 1.7050 | * | 26 Mar low | |
| R2 | 1.7400 | * | congestion | S3 | 1.7000 | * | figure, congestion | |
| R1 | 1.7250/300 | * | May low, congestion | S4 | 1.6950 | * | 61.8% 2024/2025 rally |
Asterisk denotes strength of level
07:15 GMT - Follow-through below support at the 1.7250 May low and 1.7200 level see prices extending the broader losses from the April 2025 year high. Lower will see continuation to support at the 1.7110/1.7050, April and 26 March lows. Below these will see room for extension to 1.6950, 61.8% Fibonacci level. Meanwhile, resistance is lowered to the 1.7250/1.7300 area which is expected to cap and sustain losses from the August/October double top. Would need to regain this to open up room for stronger corrective bounce to 1.7400/80 resistance.